We present results for a one-dimensional quasi-steady-state thermodynamic model developed for a 111.7 MWe concentrating solar power (CSP) system using a redox-active metal oxide as the heat storage media and heat transfer agent integrated with a combined cycle air Brayton power block. In the energy charging and discharging processes, the metal oxide CaAl0.2Mn0.8O2.9-δ (CAM28) undergoes a reversible, high temperature redox cycle including an endothermic oxygen-releasing reaction and exothermic oxygen-incorporation reaction. Concentrated solar radiation heats the redox-active oxide particles under partial vacuum to drive the reduction extent deeper for increased energy density at a fixed temperature, thereby increasing storage capacity while limiting the required on sun temperature. Direct counter-current contact of the reduced particles with compressed air from the Brayton compressor releases stored chemical and sensible energy, heating the air to 1,200°C at the turbine inlet while cooling and reoxidizing the particles. The cool oxidized particles recirculate through the solar receiver subsystem for another cycle of heating and reduction (oxygen release). We applied the techno-economic model to 1) size components, 2) examine intraday operation with varying solar insolation, 3) estimate annual performance characteristics over a simulated year, 4) estimate the levelized cost of electricity (LCOE), and 5) perform sensitivity analyses to evaluate factors that affect performance and cost. Simulations use hourly solar radiation data from Barstow, California to assess the performance of a 111.7 MWe system with solar multiples (SMs) varying from 1.2 to 2.4 and storage capacities of 6–14 h. The baseline system with 6 h storage and SM of 1.8 has a capacity factor of 54.2%, an increase from 32.3% capacity factor with no storage, and an average annual energy efficiency of 20.6%. Calculations show a system with an output of 710 GWhe net electricity per year, 12 h storage, and SM of 2.4 to have an installed cost of $329 million, and an LCOE of 5.98 ¢/kWhe. This value meets the U.S. Department of Energy’s SunShot 2020 target of 6.0 ¢/kWhe (U. S Department of Energy, 2012), but falls just shy of the 5.0 ¢/kWhe 2030 CSP target for dispatchable electricity (U. S Department of Energy, 2017). The cost and performance results are minimally sensitive to most design parameters. However, a one-point change in the weighted annual cost of capital from 8 to 7% (better understood as a 12.5% change) translates directly to an 11% decrease (0.66 ¢/kWhe) in the LCOE.
Global energy production from concentrating solar power (CSP) is expected to increase from 12 TWh in 2018 to an estimated 67–153 TWh in 2035, depending on the scenario (International Energy Agency, 2019). Total global installed capacity of CSP was 6.451 GW in 2019 (Helioscsp, 2020). IEA reports that as of the latter half of 2020 projects totaling almost 2 GW of additional capacity were under construction with 17 of the 18 projects incorporating some form of storage, e.g., molten salt (International Energy Agency, 2020). Empirical data from installed systems indicates that CSP technologies can achieve cost reductions, comparable to the reductions seen in solar photovoltaic (PV), from continued technology innovation, learning through deployment, and increased commercial competition (Lilliestam et al., 2017). CSP technologies with thermal energy storage (TES) and thermochemical energy storage (TCES) offer additional benefits in providing firm power, peak power support, and off-sun power for utility-scale generation in locations with abundant direct solar radiation (Mendelsohn et al., 2012; U.S. Department of Energy, 2014b).
CSP designs include power towers, parabolic troughs, linear Fresnel reflectors, and parabolic dishes. The higher operating temperatures of power towers, compared to parabolic trough and linear Fresnel designs, have a thermodynamic advantage that translates into cost reductions per unit energy produced (Behar et al., 2013). Basic power tower designs include five constituent systems: 1) a solar field for concentrating solar energy onto a receiver, 2) an elevated solar receiver to capture solar radiation reflected from the field, 3) heat transfer fluid(s) (HTF) to transport heat from the receiver to the power block, 4) heat exchanger(s) to transfer heat between HTF’s in the system, and 5) a power block to convert thermal energy into electric power. Most deployments today use TES to increase plant productivity, mitigate solar resource intermittency, and shift or extend production to off-sun hours. Advanced designs could use TCES as concepts evolve from laboratory R&D to a commercial ready state. CSP systems with energy storage allow utilities to schedule electricity generation from solar power (Gil et al., 2010; Denholm and Hummon, 2012). The ability to dispatch solar power is helpful for utilities seeking to avoid “duck curve” events in system net load that occur when solar photovoltaic (PV) output peaks mid-day and then declines in the late afternoon as residential loads increase (Janko et al., 2016). Further, energy storage can extend operating hours of the power block and increase capacity factors from 27 to 80% (Renewable Energy Policy Network for the 21st Century (REN21), 2015), and thereby reduce the levelized cost of energy (LCOE) (Price and Kearney, 2003; Stoddard et al., 2006; Renewable Energy Policy Network for the 21st Century (REN21), 2015). Currently installed CSP systems reached 10.3 ¢/kWh in 2017 (Mehos et al., 2016) with lower LCOE reflected in many bids for new projects. These vary by region, with successful bids reported to be as low as 6.3 ¢/kWh in Australia (Shemer, 2018a), 7.1 ¢/kWh in Morocco, and 7.3 ¢/kWh in Dubai (CSP Focus, 2019). An unsuccessful bid for a project in Chile was reported to be less than 5.0 ¢/kWh (Shemer, 2018a). Recent technical advancements in HTFs and materials are helping increase system performance and decrease cost (Liu et al., 2016).
This study develops and applies a techno-economic model of a 111.7 MWe CSP system with a redox-active metal oxide (MO) acting as both the HTF and TCES media. The techno-economic model provides a means to 1) size components, 2) examine intraday operation with varying solar insolation, 3) calculate annual performance over a simulated year, 4) estimate the LCOE, and 5) perform sensitivity analyses to evaluate factors that affect performance and cost. Application of the model to the modern Ivanpah solar generating facility operating in California, USA provided validation. The validated model indicates that an LCOE less than 6.0 ¢/kWhe is achievable given the cost assumptions for operation and maintenance and solar field (with site preparation) of 40 $/kWe-yr and 85 $/m2, respectively, for a 111.7 MWe CSP system installed with 12 h storage and SM of 2.4.
It is well known that higher temperatures (higher exergy) permit increased thermodynamic efficiency in power generation. However, current CSP plants operate at relatively low temperatures due to limitations in plant design (e.g., solar receiver geometry), physical and chemical properties of CSP materials, and thermal limitations of HTFs. The use of multiple fluids in a single CSP system such as oil in the solar receiver, molten salt in thermal energy storage, and steam in the power block (Glatzmaier, 2011) can be partly mitigate these challenges. However, for systems utilizing only sensible energy, the fluid with the lowest upper temperature boundary still limits the maximum possible temperature in the power block.
Molten salt and synthetic oils are HTFs commonly used in solar applications. Parabolic trough and linear Fresnel systems typically use synthetic oils, while power tower systems often utilize molten salts (Solar Power and Chemical Energy Systems (SolarPACES), 2020). Molten nitrate salts are preferable to oils for sensible heat storage due to their improved thermal stability, high thermal conductivity, low vapor pressure and viscosity, and relatively high energy density (Gil et al., 2010; Glatzmaier, 2011; Tian and Zhao, 2013; Vignarooban et al., 2015). However, the nitrate molten salt operating temperature range is 220°C–565°C (bounded by fusion and decomposition temperatures, respectively). These relatively low temperatures necessarily result in low (Carnot limited) power block efficiencies. Phase-changing materials are alternatives that capitalize on large latent heats for fusion and vaporization to increase stored energy density and raise operating temperatures (Zalba et al., 2003; Farid ewhich offer several advantagest al., 2004; Gil et al., 2010; Kuravi et al., 2013). Materials that undergo solid-liquid transitions have lower volumetric expansion when compared to liquid-gas transitions (Kuravi et al., 2013), yet solid-phase materials have lower thermal conductivity and are more difficult to transport than fluids (Regin et al., 2008). Solid phase-changing materials presently have limited applications within dish-Stirling engine systems wherein heat transfer occurs isothermally (Shabgard et al., 2013; Sharifi et al., 2015).
Materials that undergo a thermochemical reaction also have the potential to improve energy density, increase operating temperatures, and in some cases can act as the both HTF and storage media (Gil et al., 2010). Particle-based systems of this type build on the foundation of inert particle sensible energy systems being developed, e.g., for application to super-critical CO2 (sCO2) power cycles (Albrecht et al., 2020; González-Portillo et al., 2021). Ongoing research is evaluating the use of redox-active MO particles as a means of capturing and storing solar energy as a combination of sensible and chemical energy (General Atomics Project Staff, 2011; Neises et al., 2012; Pardo et al., 2014; Babiniec et al., 2015a; Miller et al., 2016). For these materials, solar energy heats particles above the temperature at which an endothermic reduction reaction liberates oxygen. The energetically charged MO can be stored or used immediately to heat compressed air from the compressor of an air Brayton power block, as studied herein. Both the sensible heat and heat from the reoxidation reaction are exchanged when reduced particles come into direct contact with the compressed air. Oxygen content is restored in the particles as oxygen molecules are removed from the gas phase. While binary metal oxides such as cobalt oxide, which cycles between Co3O4 and CoO, are considered to be options for this purpose (Ho and Iverson, 2014; Muroyama et al., 2015; Bush et al., 2017; Schrader et al., 2017), this study focuses on a specific group of MOs known as mixed ionic-electronic conductors (MIECs) which offer several advantages:
• Highly tunable—Thermodynamic properties manipulated through compositional variations.
• Cost reduction—Expensive constituent elements avoided through compositional variations.
• Swift utilization of bulk particles—Fast oxygen ion transport facilitates rapid and complete utilization of the capacity for reaction, i.e., mass transfer limitations do not confine the reactions to near surface regions.
• High operating temperatures—MOs remain stable at much higher temperatures than oil and molten nitrate salts, offering the opportunity to improve system efficiency.
• High energy density—Both sensible and chemical energy are stored.
• Stability over a large number of cycles—Minimal performance loss from potential chemical degradation
In the current work, we assume the use of a calcium-, aluminum-, and manganese-containing perovskite as it offers a reasonable reduction enthalpy at low material cost, fast kinetics, and superior mass specific heat capacity (Babiniec et al., 2015a; Miller et al., 2016). Related materials were reported for indirectly providing lower temperature heat to sCO2 power cycles (Imponenti et al., 2018; Albrecht et al., 2018). The material remains in the solid state up to at least 1,250°C (Babiniec et al., 2015a) and does not undergo major crystalline phase transitions, even while undergoing compositional changes (loss and uptake of oxygen). Eq. 1 shows the general form of a reversible perovskite reduction/reoxidation reaction where the reduction extent depends on temperature and partial pressure of oxygen (Babiniec et al., 2015a; Babiniec et al., 2015b; Miller et al., 2016): 1δABO3−x↔1δABO3−x−δ+12O2(g)(1)
The specific perovskite composition considered herein is CaAl0.2Mn0.8O2.9-δ (CAM28), where the A-site cation is Ca, and the B-site is shared by Al and Mn. Reduction extents as large as δ = 0.322 have been measured for this material, and are reported alongside reaction enthalpies, which vary a function of reduction extent (Babiniec et al., 2015a).
The one-dimensional thermodynamic model consists of nine system components including five power tower components (solar receiver, hot storage, reoxidation reactor, cold storage, and heat exchanger), two auxiliary components (vacuum pump, particle lift), the solar field, and power block. The Supplementary Material presents the full set of 154 thermodynamic equations for these components; we summarize them herein. We developed computational procedures in Python with fluid thermodynamic properties taken from CoolProp (Bell et al., 2014). We developed a separate model of the power block in Engineering Equation Solver (EES) to validate results against available manufacturer values and theoretical limits.
Figure 1A provides a conceptual illustration of the process in which the solar field reflects and concentrates direct normal irradiance (DNI) into the solar receiver reduction reactor (SR3). Gravity feeds oxidized particles through the SR3 where they are heated and endothermically reduced. A pump expels evolved oxygen and maintains a partial vacuum, and hence low oxygen partial pressure, in the SR3. Reduced particles exiting the SR3 can be stored in an insulated hot storage bin. Gravity feeds reduced particles from the hot storage bin into the reoxidation reactor (ROx) to come into direct contact with pressurized air (via the gas turbine compressor) flowing counter-current to the particles (Supplementary Figure S2). The resulting heat transfer and exothermic reoxidation reaction effectively increases the air to a temperature approaching 1,200°C. Heated air exiting the ROx flows to a combined cycle power block for electricity generation. Reoxidized particles can be stored in cold storage or sent back to the SR3 using a particle lift to repeat the thermodynamic cycle. A recuperating heat exchanger between high-temperature oxygen exiting the SR3 and low-temperature reduced particles entering the SR3 is included as to improve system efficiency and partially cool the O2.

FIGURE 1. (A) Conceptual diagram of the CSP/TCES system (Miller and Gill, 2020), and (B) accompanying schematic indicating mass and energy flows for the four major subsystems: solar field, power tower, power block, and auxiliary power.
A quasi-steady state thermodynamic model has been developed for the process. Figure 1B depicts the associated block diagram of components and mass and energy flows. Each component has input and output states that are solved directly or through iterative computation (e.g., the oxygen and particle streams between the SR3 and heat exchanger components are interdependent). High-temperature particle receivers for PROMOTES and other applications remain in developmental, pre-commercial stages (Muroyama et al., 2015; Ho, 2017). However, for demonstration purposes, a reactor was developed wherein particles were directly irradiated as they flowed down an inclined plane (see, for example, Schrader et al., 2020).
Therefore, the SR3 model is simplified to a concentric cylindrical geometry with adequate size for an inclined plane (Supplementary Figure S3). There is interior cavity for particle flow, cavity insulation, evacuated space, and then exterior shell for maintaining structural integrity, along with a quartz window. The ROx model is a set of cylindrical pipes in which falling particles and rising air come into direct contact to undergo simultaneous chemical and sensible heat exchange.
Table 1 provides the characteristics for the CAM28 particles. Molar mass (Mp) was determined from the molecular formula and specific heat was taken from experimental measurements (Coker et al., 2016). Particle diameter (Dp) was chosen as 130 microns, which is between the 100 and 150 microns suggested by a corresponding computational fluid dynamics (CFD) model of the ROx reactor (Babiniec, S.M., personal communication, 2018). Particle reduction was assumed to occur at 1,125°C and 200 Pa, resulting in a reduction extent (δ) of 0.2367 (interpolated from experimental measurements).
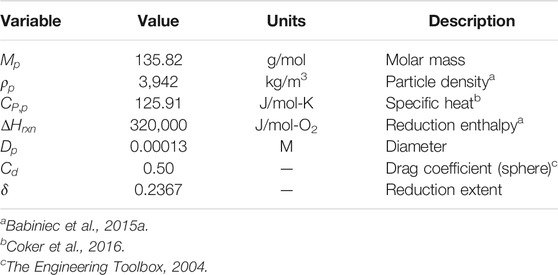
TABLE 1. CAM28 particle characteristics.
Nine of the mass flow streams shown in Figure 1B have fixed temperatures (given in Table 2), while other state point temperatures varied during calculations. The corresponding CFD model of the ROx indicated that particle outlet (T2) and oxygen outlet (T8) temperatures from the SR3 should be set to 1,125°C for the ROx to achieve 1,200°C for air turbine inlet temperature (T12). ROx particle outlet temperature (T5) is set equal to ROx air inlet temperature (T11) as a simplifying approximation. Compressor air inlet temperature (T10) is set to ambient. Turbine air exhaust temperature (T13) is set using manufacturer specifications of the gas turbine of the Ansaldo Energia AE64.3A combined cycle engine (Ansaldo Energia, 2013). Air inlet (T11) and air outlet (T12) temperatures about the ROx correspond to AE64.3A compressor outlet and turbine inlet temperatures, respectively, as evaluated using the EES model described in Supplementary Material. Nitrogen (T14) and air (T16) are assumed to enter hot storage and cold storage, respectively, at ambient temperature to maintain atmospheric pressure and isolating the reduced particles from air and premature reactive discharge.
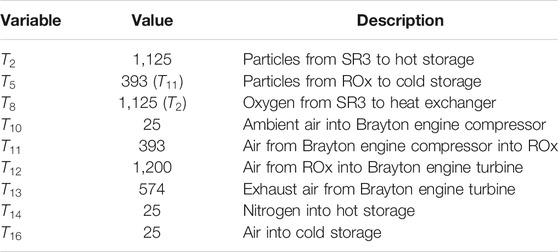
TABLE 2. Fixed temperatures (°C).
Table 3 provides input values for the ROx, SR3, heat exchanger, particle lift, vacuum pump, hot storage, and cold storage components. Air pressure (PROxcomp) and molar flow rate (n˙ROxair) through the ROx are set equal to parameters given from the AE64.3A gas turbine specifications (Ansaldo Energia, 2013). Total particle residence time (tROxr) within the ROx is approximated as the sum of residence time for particle reoxidation (tROxox) and residence time for sensible energy exchange (tROxex)to reach ROx boundary states. A lumped-capacitance model of a falling particle in the ROx provide an approximate residence time for sensible energy exchange. This results in a total particle residence time of 4 s, comparable to the 3.6 s of the corresponding CFD model of the ROx.
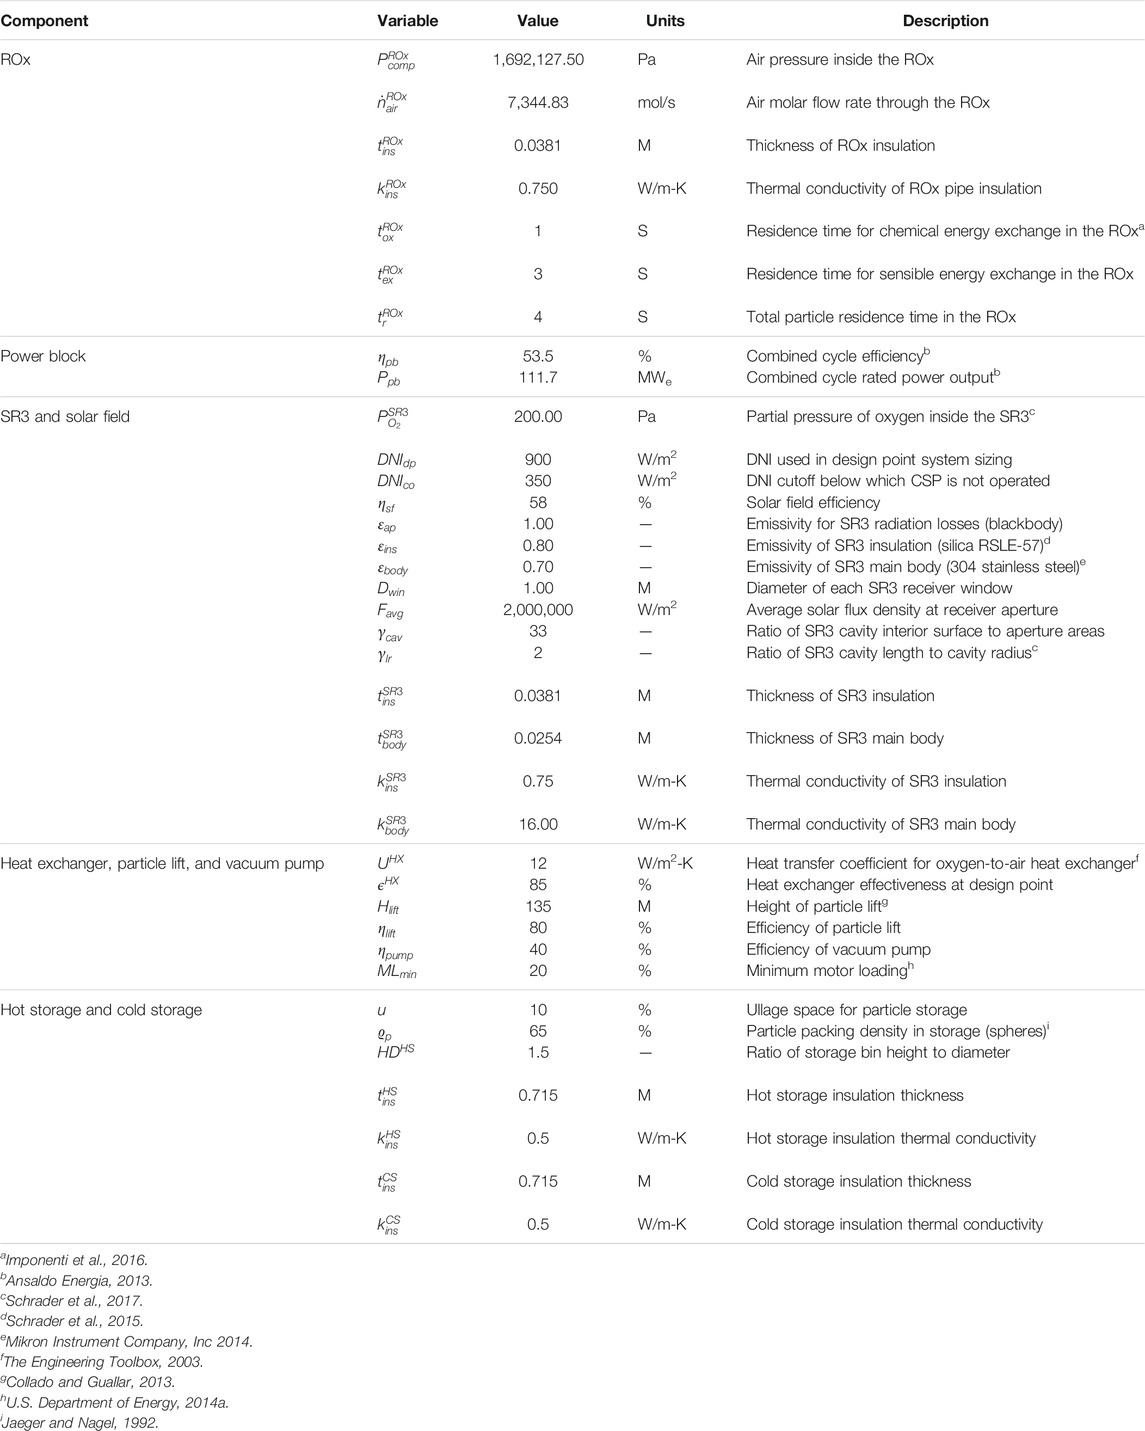
TABLE 3. Component specifications.
Thermal loss calculations for the ROx, SR3, hot storage, and cold storage use the conduction, convection, and radiation parameters given in Table 3. The ROx (kROxins), tROxins) and SR3 (kSR3ins, tSR3ins) insulation material is 1.5 inches of Zircar’s RSLE-57 (ZIRCAR Refractory Composites, Inc., 2005), a reinforced silica matrix composite used in similar high-temperature receivers for its durability at high temperatures (Christian and Ho, 2016). The SR3 main body (kSR3body, tSR3body) is 1.0 inch of 304 stainless steel (Aerospace Specification Metals, Inc. AISI Type 304 Stainless Steel) rather than HD board reported elsewhere (Christian and Ho, 2016) as additional structural support was assumed necessary. The SR3 ratio of the cavity’s interior surface area to aperture area (γlr) is taken as a design choice and evaluated further in sensitivity analysis.
The solar field efficiency (ηsf) uses the midpoint of reported annual average values of 52 and 64% (Ehrhart and Gill, 2013; Eddhibi et al., 2015). The SR3 has a minimum operating DNI (DNIco) of 350 W/m2 as a conservative estimation, whereas 300 W/m2 was used elsewhere (Zhang et al., 2010). The solar flux at the receiver aperture (Favg) assumes a concentration ratio of 2,000 suns (Zhang et al., 2013); i.e., 2 MW/m2 at the design point DNI (DNIdp). Calculations assume a conservative 1 m diameter for the SR3 quartz window (Dwin); values up to 1.7 m diameter have been reported in designs for some high-pressure receivers (Karni et al., 1998; Saung and Miller, 2014). The electric-to-mechanical efficiency of the particle lift (ηlift) is assumed similar to mine hoists (de la Vergne, 2003), and the electrical efficiency of the vacuum pump (ηpump) is set to 40% (see Supplementary Material Section 7).
Hot (kHSins, tHSins) and cold (kCSins, tCSins) storage insulation includes a combination of firebrick, perlite concrete, and reinforced concrete (El-Leathy et al., 2014; Ho et al., 2014) that have thermal conductivities of 0.21–0.57 W/m-K, 0.078–0.35 W/m-K, and 0.99–1.10 W/m-K, respectively, at high temperatures (Christy Refractories, 2004; Kanbur et al., 2013; Perlite Institute, Inc., 2014). Table 4 provides layer thicknesses alongside costs. Overall, thermal conductivity for storage insulation was approximated as 0.5 W/m-K, a conservative estimate relative to 0.31 W/m-K calculated for the firebrick, perlite concrete, and reinforced concrete layers in series.
Performance was evaluated using annual system efficiency and capacity factor averages of time series simulations. Simulations of system operation are indexed into discrete time increments (minutes, 15-minutes, hours, etc.) using i with 1 and ζ corresponding to the first and last indices, respectively, of the simulated year (e.g., ζ=8760 when using hours). If the simulated time step resolution is finer than the DNI data set’s resolution, the simulated time indices use repeated DNI values (instead of interpolated) that correspond to their time period in the DNI data set (e.g., all simulated time indices in hour 1 use the DNI value corresponding to hour 1). High resolution time stepping simulates a more continuous dispatch schedule that avoids the problem of discarding an entire hour if storage or dispatch limits would be exceeded within that hour increment; i.e. it reduces spillage. Annual generation increases by up to 11% when using 5-min time steps and up to 10% when using 10-minute time steps at small storage sizes (e.g., 2 hours) relative to hourly time steps. Computational cost increases significantly when increasing time step resolution from 10-minute to 5-min time steps but yields negligible thermal performance increase for storage sizes larger than 4 hours. Therefore, performance simulations reported here employ 10-minute time steps.
Annual average system efficiency (ηsys¯¯¯¯¯) is calculated using Eq. 2 as the product of the annual average efficiencies of four subsystems as given in Eqs 3–6. Annual average solar field efficiency (ηsf¯¯¯¯) from Eq. 3 is less than rated efficiency (ηsf) due to the lower bound DNI cutoff value and losses due to spillage. Annual average power tower efficiency (ηpt¯¯¯¯) is calculated using Eq. 4 as the net thermal energy input to the air Brayton turbine divided by the net thermal energy input to the SR3. This quantity also accounts for changes (from losses) in energy storage of the hot and cold storage bins from the initial hour of operation to the last hour of operation. Annual average power block efficiency (ηpb¯¯¯¯) is calculated using Eq. 5 as the ratio of the annual net electric generation to the thermal energy input to the air Brayton turbine. Annual average auxiliary subsystem efficiency (ηaux¯¯¯¯¯¯) is calculated using Eq. 6 as 100% minus the ratio of annual electricity used for work (particle lift and vacuum pump) to the annual net turbine electric generation. System capacity factor (CFsys) is calculated using Eq. 7 as the summation of the actual net electricity generation for the year divided by the maximum electricity generation at full capacity for a year.
A validated cost model populated with component sizes from the thermodynamic model gives estimates for the initial capital costs, operating and maintenance costs, and LCOE of the full-scale CSP system. Applying the model to the Ivanpah CSP power plant provided the validation. (See Supplementary Material Section 3.4).
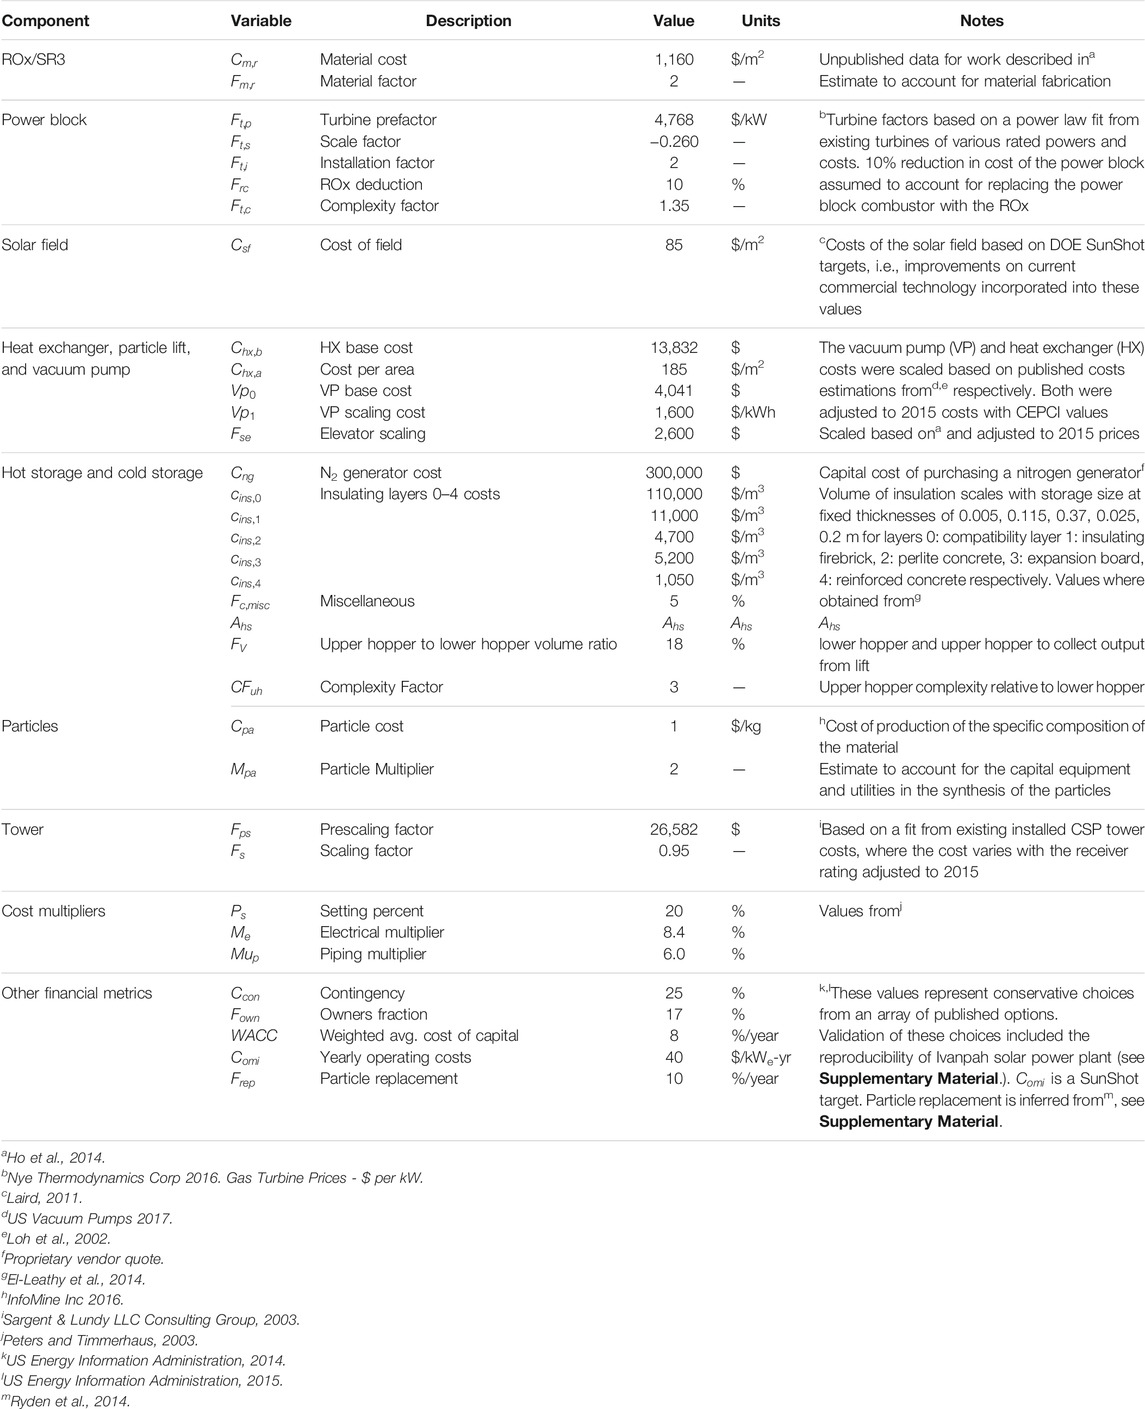
Table 4 summarizes parameters applied to estimate the total installed project cost and LCOE of the CSP system described herein. The values in the table are from manufacturer data, historical cost data for installed CSP plants, and engineering estimates when necessary. We performed sensitivity analysis to assess the relative impact of different assumptions on total capital cost and delivered energy cost.
Component costs are estimated beginning with an independent variable (e.g., component size), then applying the cost parameters in Table 4 as well as scaling functions (e.g., linear relation or power law), and cost multipliers (e.g., setting, piping, electrical, owner’s cost, and contingency) (Table 5). Multipliers account for added services or parts such as electrical, piping, fabrication, and setting.
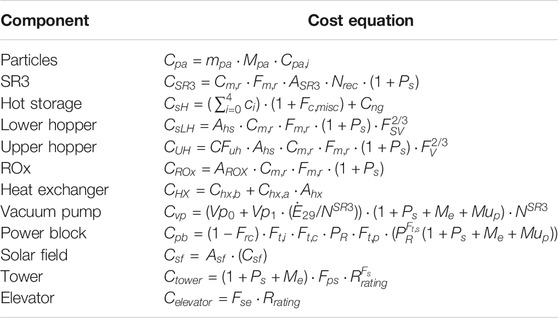
The installed costs of most components (Ccom), with exception of the power block and tower, scale linearly (although not necessarily proportionally) as a function of scale parameter (Csp), fit constants (Asp, Bsp), and total cost multipliers (CM=1+multipliers) shown in Eq.
8.Ccom=(Asp+Bsp⋅Csp)⋅CM(8)
The cost of hot storage include five insulation layers that are costed independently as illustrated in Eq.
9, where V0= Vhs.ci=(Vi−Vi−1)⋅Cins,i(9)
Costs of the tower and power block scale with a power law as shown in Eq.
10.Ccom=Apf⋅BCfparameter⋅CM(10)
The balance of plant is estimated based on the power rating (PR), the balance of plant for steam (Bps), the percent of power generated from the steam engine (Pst), and the balance of plant scale factor (Bpsf) as shown in Eq.
11.Cbp=PR⋅Bps⋅(PBpsfst) (11)
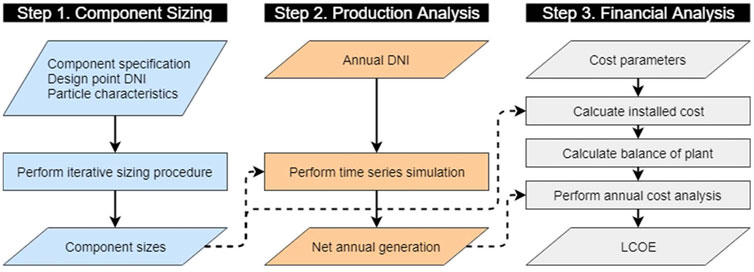
A high-level illustration of the three-step technoeconomic analysis is provided in Figure 2 with detailed procedural summaries and equation sets given in Supplementary Information. Step one sizes each component using the DNIdp, component specifications, and characteristics of CAM28 particles. State values for the 29 stream are also calculated at the DNIdp. Step two simulates plant production over a one-year period using DNI typical meteorological day (tmy3) data from Barstow (Daggett), California, USA (National Renewable Energy Laboratory, 2008). Power dispatch occurs based on solar availability and particle availability in the hot or cold storage bins. Step 3 is a financial analysis that calculates the balance of plant costs and total annual cost using design-independent assumptions, chemical engineering cost estimations, and SunShot targets for the solar field and O&M (Laird, 2011). While optimistic, well-documented roadmaps for achieving SunShot targets (U. S Department of Energy, 2012; U. S Department of Energy, 2017) have been developed. The System Advisor Model Version 2017, (SAM 2017.9.5) validated the results. Further details are included in supplementary Material. Lastly, independent parameters in each step are varied to assess the sensitivity on thermodyanic performance and cost.
Tables 6, 7 provide simulated state information for DNI dp of 900 W/m², SM of 1.8, and with the hot storage and cold storage bins initialized at half-capacity of particles. Particles displace a small amount of nitrogen from the hot storage bin while filling. Similarly, a small amount of air backfills the cold storage bin when removing particles. Table 8 provides component sizes calculated for the input values from Tables 1, 2, 3 with the energy balance and sizing equation sets detailed in Supplementary Material. The corresponding ROx CFD model (Babiniec, S.M., personal communication, 2016) provides four operational constraints that include the ROx pipe diameter (DROxh,ins) between 2 and 4 m, ROx pipe length (Lpipe) between 4 and 8 m, ROx particle outlet velocity exceeding 1 m/s, and total ROx surface area between 1,000 and 2,000 m2. These constraints are satisfied using 23 pipes (Npipe), each of diameter 2.80 m and length 5.12 m, and an average volume fraction (ϱROxp) of 0.03%. This ROx configuration supplies enough heated air to the power block to operate at rated power for 1 hour using 5,576,000 moles of particles. This amount scales to 33,456,000 moles of CAM28 particles (Np) and storage bins with an internal volume (VHS, VCS) of 1,953 m3 to provide 6 h energy storage. Solar field area at SM 1.0 (Asf1.0) is 477,203 m2. That, in turn, implies 858,965 m2 for a SM of 1.8. SR3 sizing results in 285 receiver units (Asf1.0) each with a 1 m diameter window at 2,000 suns concentration, i.e., 2 MW/m2 and 1.57 MWth through each window at design point.
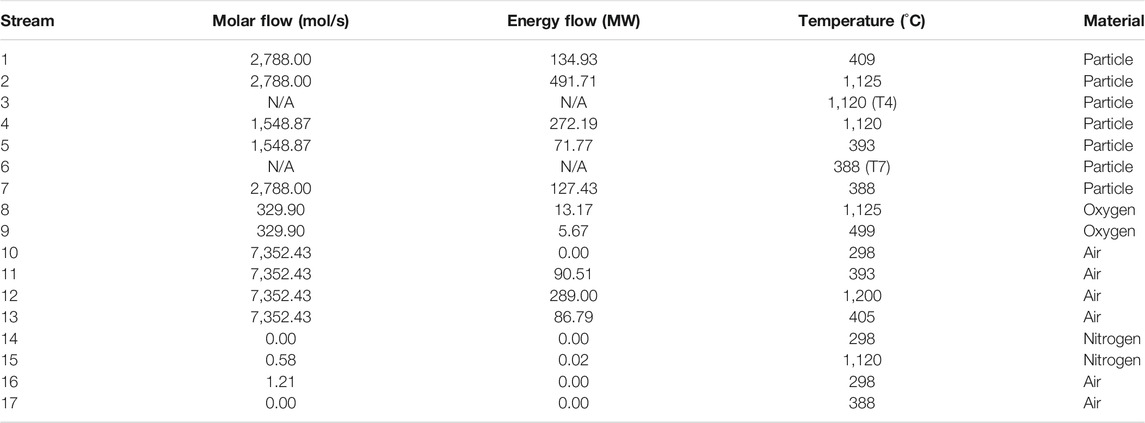
TABLE 7
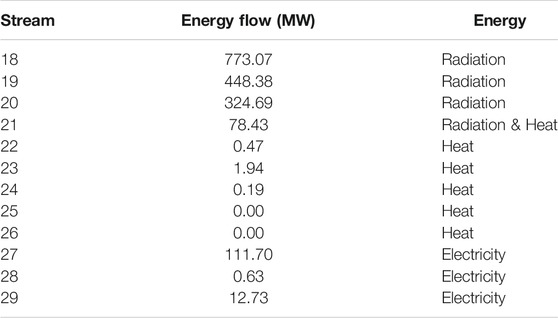
TABLE 8
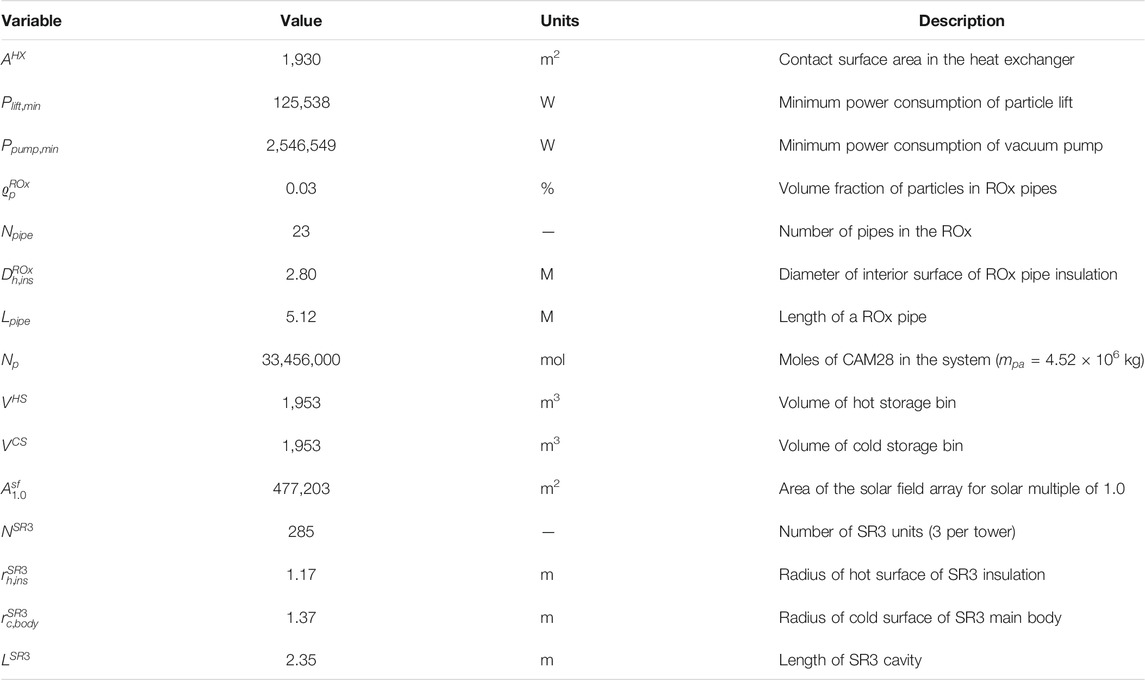
Figure 3 shows example intraday operational behavior during three seasonally representative days taken from the tmy3 dataset (National Renewable Energy Laboratory, 2008). A detailed description of the data set is provided in the user manual (Wilcox and Marion, 2008). Representative days were chosen as those from each season whose DNI most closely matched the seasonal (astronomical) average calculated from the data set. This illustration shows the particle molar flow rate through the SR3 and ROx (left vertical axis) and the amounts of particles stored in the hot and cold bins (right vertical axis). Results are shown for the baseline system with 6 hours of energy storage and a SM of 1.8. Power was dispatched when there were sufficient particles in hot storage (prior to charging from the SR3) to supply the power block for the time step. The system generated the rated power output of 111.7 MWe for 13.1 h on April 17 (1.46 GWhe), 16.7 h on June 14 (1.86 GWhe), and 8.2 h on March 12 (0.91 GWhe). The specified days in April and June utilized about 0.5 kWhth less irradiance than the values shown in Figure 3 due to the DNI cutoff, while the day in March utilized about 1.0 kWhth less for the same reason.
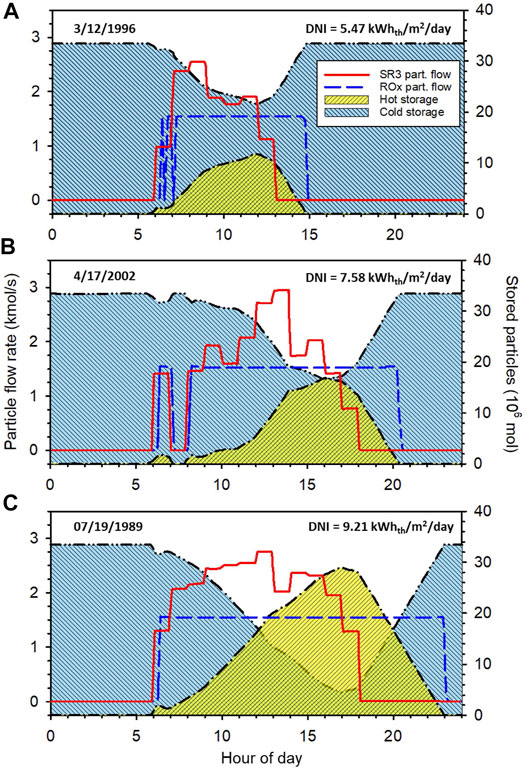
Figure 4 documents the efficiency losses along the path from the incident solar energy to the electrical output for the baseline system. Examining the major components, the solar field receives 2,339.4 GWhth of incident solar radiation in the simulated year and experiences losses of 123.5 GWhth from the DNI cutoff, 930.6 GWhth from collection losses, and 45.8 GWhth from spillage losses. Thermal losses occurring in the SR3, hot storage, cold storage, and heat exchanger consume 288.0 GWhth of the 1,239.3 GWhth energy entering the power tower. The power block efficiency of 55.7% yields 530.2 GWhe of electric generation, with power for the particle lift and vacuum pump consuming a total of 49.4 GWhe to give 480.8 GWhe of exportable energy annually. Replacing the combustor with the ROx accounts for the higher-than-rated power block efficiency. Taken as a whole, this baseline system has an annual capacity factor of 54.2% and average system efficiency of 20.6%. Note that solar collection losses and power block conversion losses account for the greatest part of the total by far at 930.6 and 421.0 GWhth, respectively. The remaining losses (thermal equivalent) in decreasing order are SR3 heat and radiation losses (268.7 GWhth), DNI cutoff (123.5 GWhth), vacuum pump (84.5 GWhth, 47.1 GWhe), spillage (45.8 GWhth), oxygen exhaust (14.1 GWhth), storage losses (5.2 GWhth), and particle lift (4.1 GWhth, 2.3 GWhe).
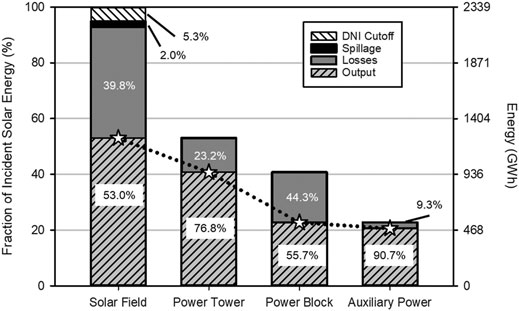
Figure 5 illustrates the combined impacts of particle storage capacity (2–14 h in 2-hour increments) and size of the solar field (SM from 1.2 to 2.6 in 0.2 increments) on the annualized capacity factor, system efficiency, total capital cost, and LCOE. Further increases in storage capacity, e.g., to 16 h, increase capital costs with little change in capacity factor or system efficiency and thus increase LCOE relative to 14 hrs, and are therefore not shown for clarity in the figure. Figure 5.A shows that the annual electricity generation (capacity factor) has a maximum value for each value of SM. That is, for each value of SM, there is a limit corresponding to a specific storage capacity, after which, further increases in storage have no impact. The capacity factor assumes a single value of 369 GWhe (37.8%) for all storage values at a SM of 1.2. This limit then increases by up to 60 GWhe (6.0%) every 0.2 increment in SM with increasing amounts of storage required to reach the new limit. At the upper limits, 14 h storage and a SM of 2.6, we calculate an annual generation (capacity factor) of 755 GWhe (77.2%).
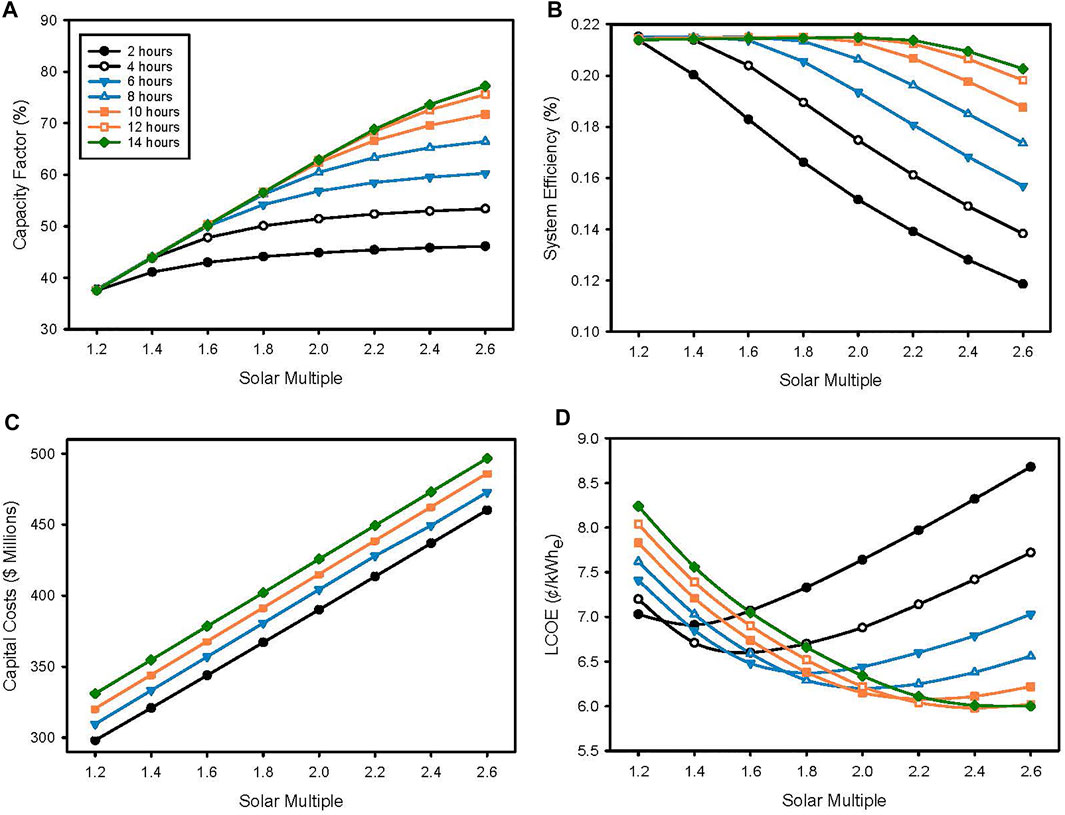
increases but then sharply decreases at higher SMs (Figure 5.B). The exception is the 2-hour storage case, which exhibits only the decrease. The initial increase with SM is attributable to increases in component utilization exceeding the associated losses. That is, for a given storage capacity, component efficiency initially increases with scale. The subsequent decreases at higher SMs are attributable to increased spillage and SR3 thermal losses. In other words, as the SM is increased, the system eventually becomes storage limited. Hence, from an efficiency point of view, there is an optimal SM for each fixed storage capacity, and vice versa. The maximum system efficiency of 21.6% was realized with both 12 and 14 h storage at a SM of 2.0.
Total plant capital cost scaled about $6.5 million for every additional 2 hours of storage and approximately $23 million for every 0.2 increment in SM(Figure 5.C). Each value of storage capacity yields a minimum value of LCOE at a different SM (Figure 5.D). The specific minimum values of LCOE are 6.91 ¢/kWhe (2 hrs, SM 1.4), 6.60 ¢/kWhe (4 hrs, 1.6), 6.37 ¢/kWhe (6 hrs, 1.8), 6.20 ¢/kWhe (8 hrs, 2.0), 6.08 ¢/kWhe (10 hrs, 2.2), 5.98 ¢/kWhe (12 hrs, 2.4), and 6.00 ¢/kWhe (14 hrs, 2.6). The overall lowest simulated LCOE of 5.98 ¢/kWhe is found for the 12 h storage system and has a corresponding capacity factor of 72.6%, system efficiency of 20.8% (ηsf¯¯¯¯=53.2%, ηpt¯¯¯¯=76.8%, ηpb¯¯¯¯=55.7%, ηaux¯¯¯¯¯¯=91.4%), and a total capital cost of $467.8 million.
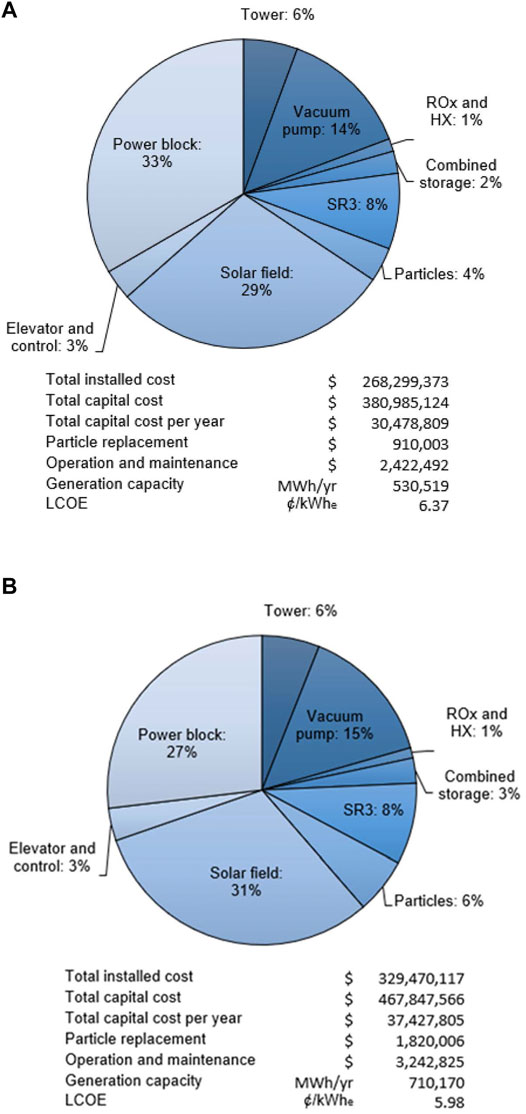
Figure 6 compares the cost breakdown for the baseline system (A) to the lower LCOE alternative with increased storage capacity of 12 h and a SM of 2.4 (B). The lower LCOE alternative requires a larger total capital cost due to increase in component sizes and replacement costs. An increase in productivity from 530,519 MWhe/yr to 710,170 MWhe/yr offsets these expenditures, which results in a 0.39 ¢/kWhe decrease in LCOE.
We performed sensitivity analyses for major design and economic parameters to assess impact on system performance and LCOE, respectively. We evaluated ten thermodynamic parameters and five economic parameters. The results highlight components of particular importance to the design and point to opportunities to decrease LCOE.
Table 9 (upper portion) illustrates the impact of six different design parameters on capacity factor: system efficiency, total capital cost, and LCOE relative to the best case (12 h storage, SM= 2.4, capacity factor = 72.6%, system efficiency = 20.8%, total project cost = $467.8 million, and LCOE of 5.98 ¢/kWhe). Not shown in the table are results for an additional four parameters: thicknesses of SR3 stainless steel body (tSR3body), ROx insulation (tROxins), hot storage insulation (tHSins), and cold storage insulation (tCSins). Changes in these parameters of −/+ 50% of base values yielded less than 0.1% change in system efficiency and less than 0.01 ¢/kWhe change in LCOE.
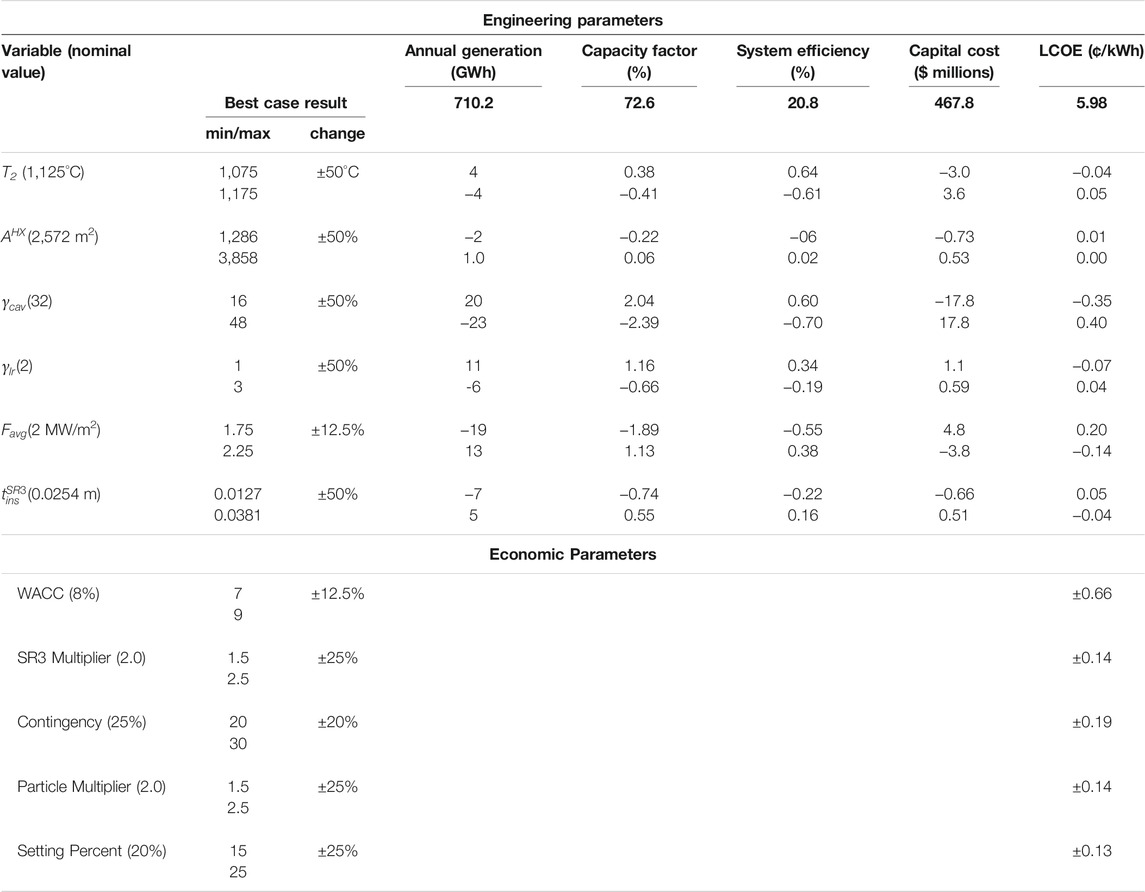
Of the six parameters in the table, reducing the ratio of the SR3 cavity interior surface area to aperture area, γcav, by 50% gives the largest increase in system efficiency (0.6%), a 2.0% increase in capacity factor, and a decrease in LCOE of 0.35 ¢/kWhe. While lowering this variable reduces thermal losses about the SR3 due to less surface area of the SR3 interior, insufficient surface area can inhibit adsorption in the receiver, not considered in this analysis.
More detailed calculations to optimize receiver efficiency relative to size is outside the scope of this effort. Reducing the particle outlet temperature, T2, by 50°C (thus also changing δ=0.2161, AHX=2,523, Asf1.0=467,150, Np=72,253,200, VHS=4,218, VCS=4,218, Lpipe=5.15, DROxh,ins=2.90) is the second most impactful change for efficiency we evaluated, increasing system efficiency by 0.6% and capacity factor by 0.4% while decreasing LCOE by only 0.04 ¢/kWhe. This change reduces thermal losses from the SR3, but low particle temperature increases the challenge in reaching the 1,200°C turbine air inlet temperature. Increasing the solar flux density, Favg, by 12.5%, i.e. increasing the energy entering the SR3, gives the third largest increase in system efficiency, 0.4%, with an accompanying increase in capacity factor of 1.3% and decrease in LCOE of 0.14 ¢/kWhe. Flux density is limited in practice by the optical precision and mirror quality of the solar field, and/or use of secondary concentrators, both of which carry cost implications not included in these evaluations. Reducing γlr by 50% achieves the fourth largest increase in system efficiency, 0.3%, with an increase in capacity factor of 1.2% and decrease in LCOE by 0.07 ¢/kWhe. This change decreases thermal losses from the SR3, but carries the same tradeoffs as changes to γcav. Increasing tSR3ins by 50% increased system efficiency by 0.2% and capacity factor by 0.6%, and decreased LCOE by 0.04 ¢/kWhe. Changes in AHX by 50% has negligible impact.
Varying cost parameters results in changes in LCOE, but not the CSP plant’s generation capacity. We analyzed five cost parameters, each of which have a positive correlation with the LCOE, and present the results in Table 9 (lower portion). The base case is the same as that for design parameters.
As expected, the WACC has by far the greatest impact of all the parameters on the LCOE. A ±1.0% change in the WACC scales to ±11% (0.66 ¢/kWhe) in the LCOE. A WACC of 7.5% (8% is used for the base case) is reasonable for countries with low interest rates and stable banking systems such as countries of the Organisation for Economic Co-operation and Development (OECD) and China. However, WACC is as high as 10% or even 11% in other parts of the world (International Renewable Energy Agency, 2015). The WACC assumes that the plant has both debt and equity. Lowering perceived risk of renewables in policy and regulation can effectively reduce WACC and therefore LCOE.
The SR3 accounts for ∼8% of the installed costs and as such provides a significant opportunity for total cost reduction. The multiplication factor in the SR3 cost equation accounts for the uncertainties associated with this novel reactor (Table 5). A 25% change in the multiplication factor changes the LCOE by 2.3% (0.14 ¢/kWhe).
The contingency parameter accounts for any unpredicted cost. We opted for a conservative design value of 25% in the base simulations. Installing the plant in a predictable area with low risk of natural disasters or political would justify a decrease in this value. A 5% change (to 20%) on this parameter decreases LCOE by an estimated 3.1%.
Although well characterized, the metal oxide is not a commercial product and therefore cost and performance uncertainties remain. In the base case, the particles account for 4% of the LCOE. The particle multiplier embodies the added cost of fabricating particles from raw materials. As illustrated, a 25% change in the particle multiplier results in a 2.4% change in LCOE.
The setting percent is a cost for installing components of the CSP plant. A 5% absolute decrease on setting multiplier reduces the LCOE by an estimated 2.2%.
We developed a one-dimensional quasi-dynamic thermodynamic model of a 111.7 MWe combined cycle air Brayton CSP system that uses a redox-active metal oxide as the heat transfer fluid and TCES media and an accompanying economic model of the system. Energy is stored as both sensible heat and chemical potential. We applied the two models to size components, simulate intraday operational behavior with varying solar insolation, evaluate annual energy efficiency and capacity factor, and calculate system costs and electrical energy production and cost.
A baseline system with 6 h storage and SM of 1.8 has a capacity factor of 54.2%, annual average system efficiency of 20.6%, and an LCOE of 6.37 ¢/kWhe over a simulated year using solar insolation data for Barstow, California, USA. The subsystem energy efficiencies for the solar field, power tower, power block, and auxiliary power are 53.0, 76.8, 55.7, and 90.7%, respectively. Solar field optical losses, power block conversion losses, and SR3 losses account for 930.6, 421.0, 268.7 GWhth, respectively, of the 2,339.4 GWh incident radiation. Increasing the storage capacity to 12 h and SM to 2.4 increases the capacity factor and system efficiency to 72.6 and 20.8%, respectively, and reduces the LCOE to 5.98 ¢/kWhe. These high capacity factors far exceed those of contemporary solar thermal 21.8%, solar PV 25.7%, and wind 34.6% plants, and compare favorably to capacity factors reported for the year 2017 in the U.S. for combined cycle natural gas 51.3%, coal 53.7%, geothermal 74.0%, and nuclear 92.2% power (US Energy Information Administration, 2018).
Our results suggest that metal oxide based thermochemical energy storage could substantially decrease the unsubsidized cost of CSP technologies; the results for the 12 h, SM 2.4 simulations are 42% less than the recently published value of ∼10.3 ¢/kWhe (Mehos et al., 2016). Examining the operation and purchase cost assumptions to identify opportunities for improvement, we note that the potential to decrease the DNI cutoff from 350 W/m2 to 200 W/m2. However, for the 12 h, SM 2.4 case the additional generation only provides additional cost reduction from 5.98 ¢/kWhe to 5.88 ¢/kWhe (a 1.7% improvement). A detailed analysis, e.g., with higher fidelity to examine transients on start-up, is necessary to provide more confidence that this change is reasonable. Combined cycle power blocks that operate at higher temperatures and hence higher efficiencies, may offer improvements. However, higher temperatures will result in greater thermal losses elsewhere in the system and/or require additional expenditures to minimize these and other issues that arise. That aside, turbomachinery is subject to ongoing improvements that may provide additional efficiency and cost benefits. Other components offering potential cost reductions include the vacuum pump, the SR3, and the ROx. Deploying a new thermochemical sorption pumping technology to provide the vacuum is a clear opportunity (Brendelberger et al., 2018). In any case, as the development and deployment of CSP technology continues to expand, total capital cost per kWe (capex) should continue to drop. Cost estimates as low as $ 3,000/kWe by 2050 are reported (Shemer, 2018b), far below the $4,188/kWe calculated in this study.
More rigorous sensitivity analyses show that variations in most design parameters have relatively minimal impact on cost and performance metrics including LCOE, with the exception of a 50% reduction in SR3 cavity interior surface area that improves LCOE by 0.35 ¢/kWhe. However, this result should be strongly caveated. Changing the SR3 cavity interior surface area has secondary impacts, for example on particle residence time and reactor radiative efficiency, that would likely alter the results but were outside the scope of this study. Increasing the flux density at the SR3 aperture by 12.5% decreased the LCOE by 0.14 ¢/kWhe, but again the result may not be feasible without incurring additional, unaccounted-for costs. No variation examined for any of the 10 parameters design parameters evaluated results in a change in system efficiency that exceeds 0.6%. Variations in cost parameters have a more direct impact on LCOE. The WACC, which applies to the system as a whole, is particularly important. A one-point change in the WACC from 8 to 7% (better understood as a 12.5% change) translates directly to an 11% decrease (0.66 ¢/kWhe) in the LCOE. Changes in other cost parameters scale more proportionally to their contribution to the overall cost.
The original contributions presented in the study are included in the article/Supplementary Material, further inquiries can be directed to the corresponding author.
BTG: thermodynamic/process modeling, heat and material balances, equipment sizing, writing and reviewing drafts. ML-L: economic modeling, writing and reviewing drafts. NGJ: supervision, writing and editing drafts. JEM: project conception and management, writing, reviewing and editing drafts. Writing and preparing final versions. EBS: supervision, systems and technoeconomic models and verification, writing, reviewing and editing drafts and final versions.
The U.S. Department of Energy (DOE) SunShot Initiative provided funding for the project entitled High Performance Reduction/Oxidation Metal Oxides for Thermochemical Energy Storage (PROMOTES) under award number DE-FOA-0000805-1541 as part of the CSP:ELEMENTS program. The NSF IGERT-SUN (1144616) program at Arizona State University work also provided partial funding. The PROMOTES project portion of the funding at Arizona State University was provided via a subcontract from Sandia National Laboratories. Sandia National Laboratories is a multi-mission laboratory managed and operated by National Technology and Engineering Solutions of Sandia LLC, a wholly owned subsidiary of Honeywell International Inc. for the U.S. Department of Energy’s National Nuclear Security Administration under contract DE-NA0003525.
The authors declare that the research was conducted in the absence of any commercial or financial relationships that could be construed as a potential conflict of interest.
All claims expressed in this article are solely those of the authors and do not necessarily represent those of their affiliated organizations, or those of the publisher, the editors and the reviewers. Any product that may be evaluated in this article, or claim that may be made by its manufacturer, is not guaranteed or endorsed by the publisher.
The authors would like to thank all the members of the PROMOTES team for useful conversations and insights, including Dr. Andrea Ambrosini, Prof. Hany Al Ansari, Dr. Sean Babiniec, Dr. Eric Coker, Dr. Cliff Ho, Prof. Sheldon Jeter, Prof. Peter Loutzenheiser, and Andrew Schrader.
The Supplementary Material for this article can be found online at:
https://www.frontiersin.org/articles/10.3389/fenrg.2021.734288/full#supplementary-material
Aerospace Specification Metals, Inc. AISI Type 304 Stainless Steel (). Aerospace Specification Metals, Inc. Data from: AISI Type 304 Stainless Steel.
Available at: http://asm.matweb.com/search/SpecificMaterial.asp? bassnum=MQ304A (Accessed December 22, 2020).
Albrecht, K. J., Carlson, M. D., Laubscher, H. F., Crandell, R., DeLovato, N., and Ho, C. K. (2020). Testing and Model Validation of a Prototype Moving Packed-Bed Particle-To-sCO₂ Heat Exchanger. AIP Conf. Proc. 2303, 030002. doi:10.1063/5.0031483
Albrecht, K. J., Jackson, G. S., and Braun, R. J. (2018). Evaluating Thermodynamic Performance Limits of Thermochemical Energy Storage Subsystems Using Reactive Perovskite Oxide Particles for Concentrating Solar Power. Solar Energy 167, 179–193. doi:10.1016/j.solener.2018.03.078
Ansaldo Energia (2013). AE64.3A Gas Turbine (Data Sheet).
Available at: http://ansaldoenergia.it/easyUp/file/gas_turbine_ae64_3a_june2013.pdf.
Babiniec, S. M., Coker, E. N., Miller, J. E., and Ambrosini, A. (2015a). Doped Calcium Manganites for Advanced High-Temperature Thermochemical Energy Storage. Int. J. Energ. Res. 40, 280–284. doi:10.1002/er.3467
Babiniec, S. M., Coker, E. N., Miller, J. E., and Ambrosini, A. (2015b). Investigation of Lax Sr1−xCoy M1−yO3−δ (M = Mn, Fe) Perovskite Materials as Thermochemical Energy Storage media. Sol. Energy 118, 451–459. doi:10.1016/j.solener.2015.05.040
Behar, O., Khellaf, A., and Mohammedi, K. (2013). A Review of Studies on central Receiver Solar thermal Power Plants. Renew. Sustain. Energ. Rev. 23, 12–39. doi:10.1016/j.rser.2013.02.017
Bell, I. H., Wronski, J., Quoilin, S., and Lemort, V. (2014). Pure and Pseudo-pure Fluid Thermophysical Property Evaluation and the Open-Source Thermophysical Property Library CoolProp. Ind. Eng. Chem. Res. 53, 2498–2508. doi:10.1021/ie4033999
Brendelberger, S., Vieten, J., Vidyasagar, M. J., Roeb, M., and Sattler, C. (2018). Demonstration of Thermochemical Oxygen Pumping for Atmosphere Control in Reduction Reactions. Solar Energy 170, 273–279. doi:10.1016/j.solener.2018.05.063
Christian, J., and Ho, C. (2016). Design Requirements, Challenges, and Solutions for High-Temperature Falling Particle Receivers. AIP Conf. Proc. 1734, 030008. doi:10.1063/1.4949060
Christy Refractories (2004). Data From: Insulating Firebrick.
Available at: http://www.christyco.com/pdf/crc/Insulating_Firebrick_Data_Sheet.pdf.
Coker, E., Babiniec, S., Ambrosini, A., and Miller, J. (2016). “Metal Oxides With Ionic-Electronic Conductivity for Thermochemical Energy Storage,” in ECI Symposium Series: CO2 Summit II: Technologies and Opportunities (preprint/presentation).
Document available at https://www.osti.gov/servlets/purl/1365103. Abstract available at http://dc.engconfintl.org/co2_summit2/38 (Accessed September 13, 2021).
Collado, F. J., and Guallar, J. (2013). A Review of Optimized Design Layouts for Solar Power tower Plants with campo Code. Renew. Sustain. Energ. Rev. 20, 142–154. doi:10.1016/j.rser.2012.11.076
CSP Focus (2019). Chile CSP Developer Predicts World’s Lowest price in June (November 28, 2019). Available at: http://www.cspfocus.cn/en/market/detail_2406.htm (Accessed December 11, 2020).
de la Vergne, J. (2003). Hard Rock Miner’s Handbook. third ed. Tempe, AZ: McIntosh Engineering Limited.
Denholm, P., and Hummon, M. (2012). Simulating the Value of Concentrating Solar Power with Thermal Energy Storage in a Production Cost Model. Natl. Renew. Energ. Lab. Tech. Rep. NREL/TP-6A20-56731. doi:10.2172/1059140
Eddhibi, F., Amara, M. B., Balghouthi, M., and Guizani, A. (2015). Optical Study of Solar tower Power Plants. J. Phys. Conf. Ser. 596, 012018. doi:10.1088/1742-6596/596/1/012018
Ehrhart, B., and Gill, D. (2014). Evaluation of Annual Efficiencies of High Temperature central Receiver Concentrated Solar Power Plants with thermal Energy Storage. Energ. Proced. 49, 752–761. doi:10.1016/j.egypro.2014.03.081
El-Leathy, A., Jeter, S., Al-Ansary, H., Abdel-Khalik, S., Roop, J., Golob, M., et al. (2014). Thermal Performance Evaluation of Two thermal Energy Storage Tank Design Concepts for Use with a Solid Particle Receiver-Based Solar Power tower. Energies 7, 8201–8216. doi:10.3390/en7128201
Evan Bush, H., Schlichting, K.-P., Gill, R. J., Jeter, S. M., and Loutzenhiser, P. G. (2017). Design and Characterization of a Novel Upward Flow Reactor for the Study of High-Temperature Thermal Reduction for Solar-Driven Processes. Energy Eng. 139 (5), 051004. Sol. doi:10.1115/1.4037191
Farid, M. M., Khudhair, A. M., Razack, S. A. K., and Al-Hallaj, S. (2004). A Review on Phase Change Energy Storage: Materials and Applications. Energ. Convers. Manage. 45, 1597–1615. doi:10.1016/j.enconman.2003.09.015
General Atomics Project Staff (2011). Thermochemical Heat Storage for Concentrated Solar Power, GA–C27137 (Technical report). San Diego, CA: Prepared General Atomics for the U.S. Department of Energy under DE-FG36-08GO18145. doi:10.2172/1039304
Gil, A., Medrano, M., Martorell, I., Lázaro, A., Dolado, P., Zalba, B., et al. (2010). State of the Art on High Temperature thermal Energy Storage for Power Generation. Part 1-Concepts, Materials and Modellization. Renew. Sustain. Energ. Rev. 14, 31–55. doi:10.1016/j.rser.2009.07.035
Glatzmaier, G. (2011). Summary Report for Concentrating Solar Power Thermal Storage Workshop: New Concepts and Materials for Thermal Energy Storage and Heat-Transfer Fluids, NREL/TP- 5500-52134. (Technical report). Golden, CO: National Renewable Energy Laboratory. doi:10.2172/1022291
González-Portillo, L. F., Albrecht, K., and Ho, C. K. (2021). Techno-Economic Optimization of CSP Plants with Free-Falling Particle Receivers. Entropy 23, 76. doi:10.3390/e23010076
Helioscsp, (2020). Concentrated Solar Power Had a Global Total Installed Capacity of 6,451 MW in 2019.
Available at: https://helioscsp.com/concentrated-solar-power-had-a-global-total-installed-capacity-of-6451-mw-in-2019/(Accessed December 11, 2020).
Ho, C., Christian, J., Gill, D., Moya, A., Jeter, S., Abdel-Khalik, S., et al. (2014). Technology Advancements for Next Generation Falling Particle Receivers. Energ. Proced. 49, 398–407. doi:10.1016/j.egypro.2014.03.043
Ho, C. K. (2017). Advances in central Receivers for Concentrating Solar Applications. Solar Energy 152, 38–56. doi:10.1016/j.solener.2017.03.048
Ho, C. K., and Iverson, B. D. (2014). Review of High-Temperature central Receiver Designs for Concentrating Solar Power. Renew. Sustain. Energ. Rev. 29, 835–846. doi:10.1016/j.rser.2013.08.099
Imponenti, L., Albrecht, K. J., Braun, R. J., and Jackson, G. S. (2016). Measuring Thermochemical Energy Storage Capacity with Redox Cycles of Doped-CaMnO3. ECS Trans. 72, 11–22. doi:10.1149/07207.0011ecst
Imponenti, L., Albrecht, K. J., Kharait, R., Sanders, M. D., and Jackson, G. S. (2018). Redox Cycles with Doped Calcium Manganites for Thermochemical Energy Storage to 1000 °C. Appl. Energ. 230, 1–18. doi:10.1016/j.apenergy.2018.08.044
InfoMine Inc. (2016). Data from: Commodity and Metal Prices. Currently Available at https://www.mining.com/markets/.
International Energy Agency (2020). Renewables 2020 – Analysis and Forecast to 2025. Paris: IEA.
International Energy Agency (2019). World Energy Outlook 2019. Paris: IEA. ISBN 978-92-64-97300-8.
International Renewable Energy Agency (2015). Renewable Power Generation Costs in 2014. Abu Dhabi: IRENA.
Available at: https://irena.org/-/media/Files/IRENA/Agency/Publication/2015/IRENA_RE_Power_Costs_2014_report.pdf.
Jaeger, H. M., and Nagel, S. R. (1992). Physics of the Granular State. Science 255, 1523–1531. doi:10.1126/science.255.5051.1523
Janko, S. A., Arnold, M. R., and Johnson, N. G. (2016). Implications of High-Penetration Renewables for Ratepayers and Utilities in the Residential Solar Photovoltaic (PV) Market. Appl. Energ. 180, 37–51. doi:10.1016/j.apenergy.2016.07.041
Kanbur, B. B., Atayilmaz, S. O., Demir, H., Koca, A., and Gemici, Z. (2013). Investigating the thermal Conductivity of Different concrete and Reinforced concrete Models with Numerical and Experimental Methods. Recent Adv. Mech. Eng. Appl. Recent Adv. 8, 95–101.
Karni, J., Kribus, A., Ostraich, B., and Kochavi, E. (1998). A High-Pressure Window for Volumetric Solar Receivers. J. Sol. Energ. Eng. 120, 101–107. doi:10.1115/1.2888051
Kuravi, S., Trahan, J., Goswami, D. Y., Rahman, M. M., and Stefanakos, E. K. (2013). Thermal Energy Storage Technologies and Systems for Concentrating Solar Power Plants. Prog. Energ. Combustion Sci. 39, 285–319. doi:10.1016/j.pecs.2013.02.001
Laird, J. (2011). The Biggest challenge. Renew. Energ. Focus 12, 72–77. doi:10.1016/s1755-0084(11)70106-5
Lilliestam, J., Labordena, M., Patt, A., and Pfenninger, S. (2017). Empirically Observed Learning Rates for Concentrating Solar Power and Their Responses to Regime Change. Nat. Energ. 2, 17094. doi:10.1038/nenergy.2017.94
Liu, M., Steven Tay, N. H., Belusko, M., Jacob, R., Will, G., et al. (2016). Review on Concentrating Solar Power Plants and New Developments in High Temperature thermal Energy Storage Technologies. Renew. Sustain. Energ. Rev. 53, 1411–1432. doi:10.1016/j.rser.2015.09.026
Loh, H. P., Lyons, J., Lyons, J., and White, C. W. 2002). Process Equipment Cost Estimation, Final Report. doi:10.2172/797810
Mehos, M., Turchi, C., Jorgenson, J., Denholm, P., Ho, C., and Armijo, K. (2016). On the Path to SunShot: Advancing Concentrating Solar Power Technology, Performance, and Dispatchability. NNREL/TP-5500-65688 and SAND2016-2237R. (Technical report). Golden, CO and Albuquerque, NM: National Renewable Energy Laboratory and Sandia National Laboratories. http://www.nrel.gov/docs/fy16osti/65688.pdf
Mendelsohn, M., Lowder, T., and Canavan, B. (2012). Utility-Scale Concentrating Solar Power and Photovoltaic Projects: A Technology and Market Overview. Natl. Renew. Energ. Lab. Tech. Rep. NREL/TP-6A20-51137. doi:10.2172/1039803
Mikron Instrument Company, Inc (2014). Data from: Table of Emissivity of Various Surfaces.
Available at: http://www-eng.lbl.gov/∼dw/projects/DW4229_LHC_detector_analysis/calculations/emissivity2.pdf
Miller, J. E., Ambrosini, A., Babiniec, S. M., Coker, E. N., Ho, C. K., Al-Ansary, H., et al. (2016). High Performance Reduction/Oxidation Metal Oxides for Thermochemical Energy Storage (PROMOTES), Paper No. ES2016–59660. V001T04A024. doi:10.1115/ES2016-59660
Miller, J., and Gill, D. (2014). SunShot Initiative: Awardee Technical Summary. High Performance Reduction/Oxidation Metal Oxides for Thermochemical Energy Storage (PROMOTES).
Available at: https://energy.gov/eere/sunshot/project-profile-high-performance-reductionoxidation-metal-oxides-thermochemical-energy (Accessed December 20, 2020).
Muroyama, A. P., Schrader, A. J., and Loutzenhiser, P. G. (2015). Solar Electricity via an Air Brayton Cycle with an Integrated Two-step Thermochemical Cycle for Heat Storage Based on Co3O4/CoO Redox Reactions II: Kinetic Analyses. Solar Energy 122, 409–418. doi:10.1016/j.solener.2015.08.038
National Renewable Energy Laboratory (2008). Data From: National Solar Radiation Data Base.
Available at: http://rredc.nrel.gov/solar/old_data/nsrdb/1991-2005/tmy3/by_state_and_city.htmlhttps://nsrdb.nrel.gov/data-sets/archives.html.
Neises, M., Tescari, S., de Oliveira, L., Roeb, M., Sattler, C., and Wong, B. (2012). Solar-heated Rotary kiln for Thermochemical Energy Storage. Solar Energy 86, 3040–3048. doi:10.1016/j.solener.2012.07.012
Nye Thermodynamics Corp (2016). Gas Turbine Prices. Data from: Gas Turbine Prices $ per kW.
Available at: http://nyethermodynamics.com/trader/kwprice.htm.
Pardo, P., Deydier, A., Anxionnaz-Minvielle, Z., Rougé, S., Cabassud, M., and Cognet, P. (2014). A Review on High Temperature Thermochemical Heat Energy Storage. Renew. Sustain. Energ. Rev. 32, 591–610. doi:10.1016/j.rser.2013.12.014
Perlite Institute, Inc (2014). Data From: Overview of Perlite Concrete).
Available at: https://www.perlite.org/library-perlite-info/construction-perlite/Perlite-Concrete.pdf.
Peters, M. S., and Timmerhaus, K. D. (2003). Plant Design and Economics for Chemical Engineers. 5th ed. New York: McGraw-Hill.
Price, H., and Kearney, D. (2003). Reducing the Cost of Energy from Parabolic Trough Solar Power Plants. Solar Energy 591, ISEC2003–44069. doi:10.1115/isec2003-44069
Regin, A. F., Solanki, S. C., and Saini, J. S. (2008). Heat Transfer Characteristics of thermal Energy Storage System Using PCM Capsules: A Review. Renew. Sustain. Energ. Rev. 12 (9), 2438–2458. doi:10.1016/j.rser.2007.06.009
Renewable Energy Policy Network for the 21st Century (REN21) (2015). Renewables 2015 Global Status Report. Paris, France: GSR2015_Full-Report_English.pdf (ren21.net) (Accessed December 22, 2020).
Rydén, M., Moldenhauer, P., Lindqvist, S., Mattisson, T., and Lyngfelt, A. (2014). Measuring Attrition Resistance of Oxygen Carrier Particles for Chemical Looping Combustion with a Customized Jet Cup. Powder Technol. 256, 75–86. doi:10.1016/j.powtec.2014.01.085
Sargent & Lundy LLC Consulting Group. (2003). Assessment of Parabolic Trough and Power Tower Solar Technology Cost and Performance Forecasts. NREL/SR-550-34440. (Technical Report). Golden, CO: National Renewable Energy Laboratory. doi:10.2172/15005520
Saung, E., and Miller, F. J. (2014). Dome Window and Mount Design for a 5 MWth Solar Receiver. Energ. Proced. 49, 514–523. doi:10.1016/j.egypro.2014.03.055
Schrader, A. J., De Dominicis, G., Schieber, G. L., and Loutzenhiser, P. G. (2017). Solar Electricity via an Air Brayton Cycle with an Integrated Two-step Thermochemical Cycle for Heat Storage Based on Co3O4/CoO Redox Reactions III: Solar Thermochemical Reactor Design and Modeling. Solar Energy 150, 584–595. doi:10.1016/j.solener.2017.05.003
Schrader, A. J., Muroyama, A. P., and Loutzenhiser, P. G. (2015). Solar Electricity via an Air Brayton Cycle with an Integrated Two-step Thermochemical Cycle for Heat Storage Based on Co3O4/CoO Redox Reactions: Thermodynamic Analysis. Solar Energy 118, 485–495. doi:10.1016/j.solener.2015.05.045
Schrader, A. J., Schieber, G. L., Ambrosini, A., and Loutzenhiser, P. G. (2020). Experimental Demonstration of a 5 kWth Granular-Flow Reactor for Solar Thermochemical Energy Storage with Aluminum-Doped Calcium Manganite Particles. Appl. Therm. Eng. 173, 115257. doi:10.1016/j.applthermaleng.2020.115257
Shabgard, H., Faghri, A., Bergman, T. L., and Andraka, C. E. (2013). Numerical Simulation of Heat Pipe-Assisted Latent Heat Thermal Energy Storage Unit for Dish-Stirling Systems. J. Sol. Energy Eng., 136, 021025. doi:10.1115/1.4025973
Sharifi, N., Faghri, A., Bergman, T. L., and Andraka, C. E. (2015). Simulation of Heat Pipe-Assisted Latent Heat thermal Energy Storage with Simultaneous Charging and Discharging. Int. J. Heat Mass Transfer 80, 170–179. doi:10.1016/j.ijheatmasstransfer.2014.09.013
Shemer, N. (2018b). New Energy Update. CSP Capex Costs Fall by Almost Half as Developers Shift towards China and Middle East.
Available at:
http://analysis.newenergyupdate.com/csp-today/csp-capex-costs-fall-almost-half-developers-shift-towards-china-and-middle-easthttps://www.reutersevents.com/renewables/csp-today/csp-capex-costs-fall-almost-half-developers-shift-towards-china-and-middle-east (now available at April 16, 2018).
Shemer, N. (2018a). Reuters Events: Renewables. As CSP Bids Fall to Record Lows, Prices Diverge between Regions.
Available at: https://www.reutersevents.com/renewables/csp-today/csp-bids-fall-record-lows-prices-diverge-between-regions (Accessed FebruaryDecember 2011, 20182020).
Solar Power and Chemical Energy Systems (SolarPACES) worldwide database of CSP projects (2020). Maintained by National Renewable Energy Laboratory.
Available at: www.nrel.gov/csp/data-tools.htmlhttps://solarpaces.nrel.gov/ (Accessed December 22, 2020).
Stoddard, L., Abiecunas, J., and O’Connell, R. (2006). Economic, Energy, and Environmental Benefits of Concentrating Solar Power in California. NREL/SR-550-39291. (Technical report). Golden, CO: National Renewable Energy Laboratory. doi:10.2172/881924
System Advisor Model Version 2017.9.5 (2017). National Renewable Energy Laboratory. Golden.
Available at: https://sam.nrel.gov/content/downloads (Accessed October 31, 2016).
The Engineering Toolbox (2004). Data From: Drag Coefficient.
Available at: http://www.engineeringtoolbox.com/drag-coefficient-d_627.html
The Engineering Toolbox (2003). Data From: Heat Exchanger Heat Transfer Coefficients.
Available at: http://www.engineeringtoolbox.com/heat-transfer-coefficients-exchangers-d_450.html
Tian, Y., and Zhao, C. Y. (2013). A Review of Solar Collectors and thermal Energy Storage in Solar thermal Applications. Appl. Energ. 104, 538–553. doi:10.1016/j.apenergy.2012.11.051
U.S Department of Energy. (2012). SunShot Vision Study: February 2012, DOE/GO-102012-3037. (Technical report). Washington, D.C.: USDOEdoi:10.2172/1039075
US Vacuum Pumps. (2017). Available at: www.usvacuumpumps.com (Accessed August, 2017).
U.S Department of Energy (2014b). Determining Electric Motor Load and Efficiency.
Available at: https://www.energy.gov/sites/prod/files/2014/04/f15/10097517.pdf.
U.S Department of Energy (2014a). MAP: Concentrating Solar Power across the United States.
Available at: https://energy.gov/articles/map-concentrating-solar-power-across-united-states (Accessed December 22, 2020).
U.S Department of Energy (2017). The SunShot 2030 Goals: 3¢ Per Kilowatt Hour for PV and 5¢ Per Kilowatt Hour for Dispatchable CSP. Report DOE/EE-1501.
Available at: https://www.energy.gov/sites/prod/files/2020/09/f79/SunShot%202030%20White%20Paper.pdf.
U.S. Energy Information Administration (2015). Annual Energy Outlook 2015 with Projections to 2040. DOE/EIA0383(2015). Washington, DC: US Department of Energy.
Available at: https://www.eia.gov/outlooks/aeo/pdf/0383(2015).pdf.
U.S. Energy Information Administration (2018). Electric Power Monthly with Data for October 2018, December 2018. USIEA Tech. Rep.
Available at: https://www.eia.gov/electricity/monthly.
U.S. Energy Information Administration (2014). Washington, DC: US Department of Energy.
Available at: https://www.eia.gov/outlooks/aeo/nems/documentation/international/pdf/m071(2014).pdf.
International Energy Module of the National Energy Modeling System: Model Documentation 2014.
Vignarooban, K., Xu, X., Arvay, A., Hsu, K., and Kannan, A. M. (2015). Heat Transfer Fluids for Concentrating Solar Power Systems – A Review. Appl. Energ. 146, 383–396. doi:10.1016/j.apenergy.2015.01.125
Wilcox, S., and Marion, W. (2008). Users Manual for TMY3 Data Sets. NREL/TP-581-43156. (Technical report). Golden, CO: National Renewable Energy Laboratory. doi:10.2172/928611
Zalba, B., Marı́n, J. M., Cabeza, L. F., and Mehling, H. (2003). Review on thermal Energy Storage with Phase Change: Materials, Heat Transfer Analysis and Applications. Appl. Therm. Eng. 23, 251–283. doi:10.1016/s1359-4311(02)00192-8
Zhang, H. L., Baeyens, J., Degrève, J., and Cacères, G. (2013). Concentrated Solar Power Plants: Review and Design Methodology. Renew. Sustain. Energ. Rev. 22, 466–481. doi:10.1016/j.rser.2013.01.032
Zhang, Y., Smith, S. J., Kyle, G. P., and Stackhouse, P. W. (2010). Modeling the Potential for thermal Concentrating Solar Power Technologies. Energy Policy 38, 7884–7897. doi:10.1016/j.enpol.2010.09.008
ZIRCAR Refractory Composites, Inc. (2005). Silica Composite Materials (Data Sheet).
Available at: http://www.zrci.com/wdpr/wp-content/uploads/2016/05/zrci201.pdf\.
Keywords: concentrating solar power, redox active metal oxide materials, thermochemical cycles, renewable energy, techno-economic analysis, thermochemical energy storage
Citation: Gorman BT, Lanzarini-Lopes M, Johnson NG, Miller JE and Stechel EB (2021) Techno-Economic Analysis of a Concentrating Solar Power Plant Using Redox-Active Metal Oxides as Heat Transfer Fluid and Storage Media. Front. Energy Res. 9:734288. doi: 10.3389/fenrg.2021.734288
Received: 30 June 2021; Accepted: 26 August 2021;
Published: 01 December 2021.
Edited by:
Alfonso J. Carrillo, Instituto de Tecnología Química (ITQ), Spain
Reviewed by:
Miguel Angel Reyes-Belmonte, Rey Juan Carlos University, Spain
Nick AuYeung, Oregon State University, United States