Due to costs and other barriers, solar thermal’s present footprint on the global energy production map is negligible. Industry experts agree that the concentrated solar power industry needs to reduce the cost of the heat they produce and overcome a host of barriers and that if they manage to do so, the market potential for their solution should be significant (e.g. [1]). But it is hard to find estimates of how significant the market opportunity is and at what prices concentrating solar power needs to be offered to the market to realize the potential.
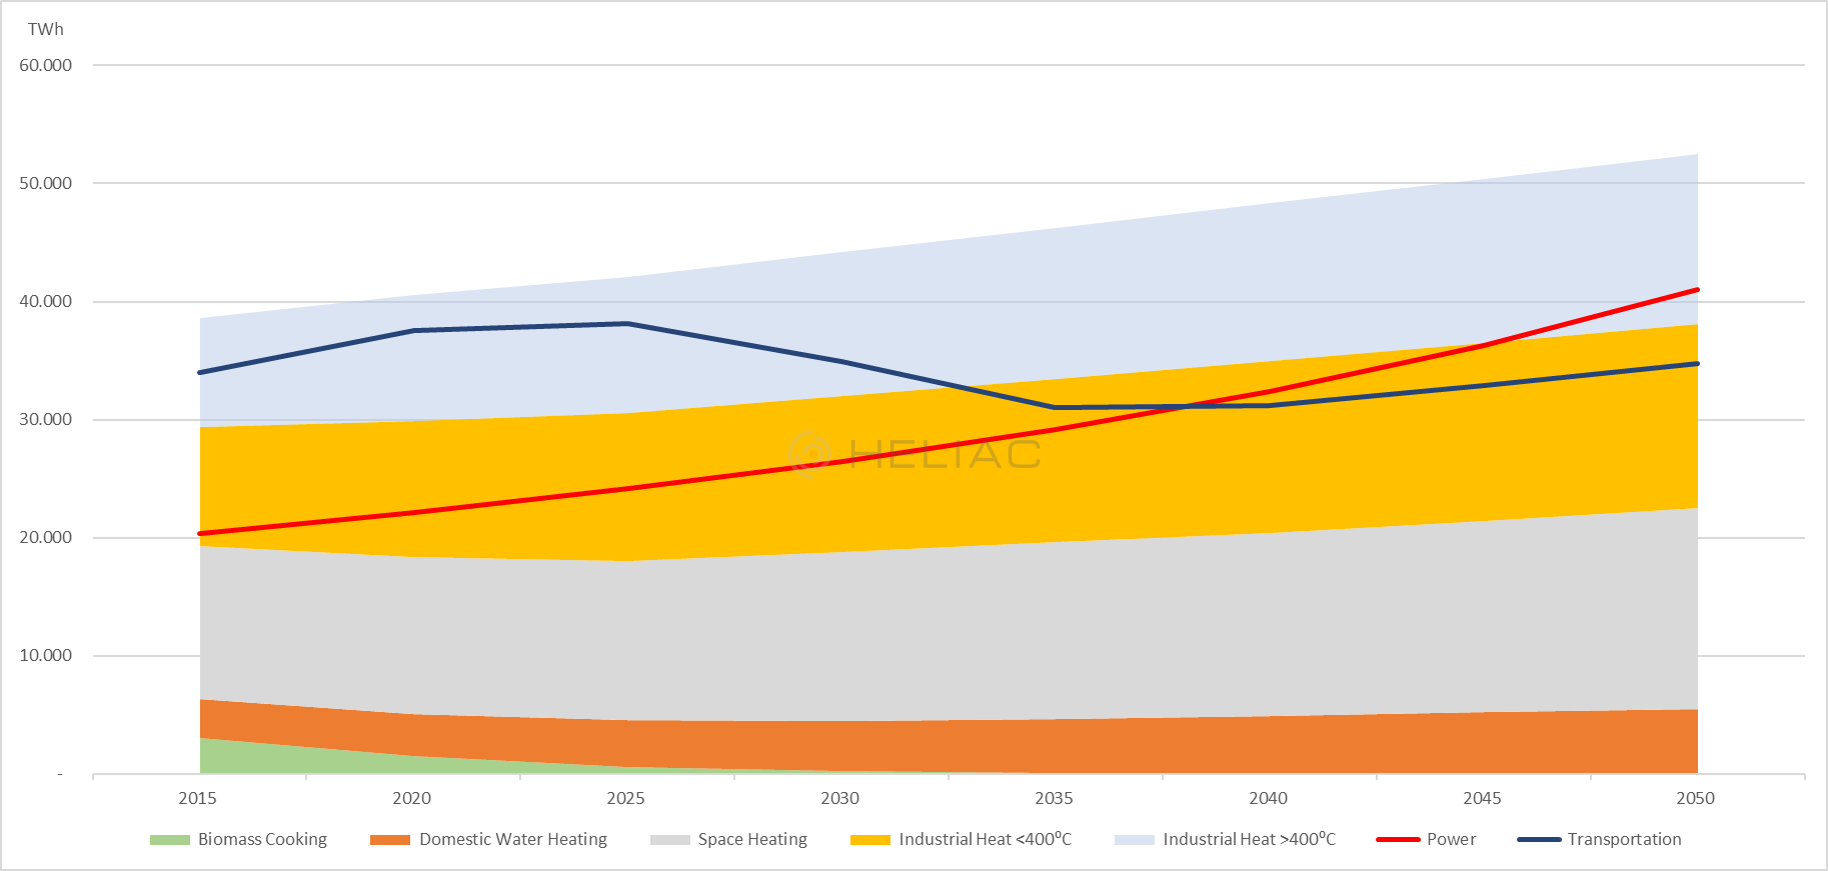
Figure 1: Global total final energy consumption in a scenario based on 100% renewables by 2050 [2]+[3].
Heat is heat no matter how it is produced. Consequently, most end-users producing products for price-sensitive markets are prone to go for the cheapest source which today is fossil fuels. In this article, I will try to estimate the price tag solutions must meet to compete head-to-head with natural gas in the US market and in Europe. I will also estimate the market potential for solar heat for industrial processes in the range of 120⁰C-220⁰C. In an upcoming article, I identify barriers to reaching these price targets and discuss how to circumvent other market barriers.
My estimates are based on several assumptions all of which can be discussed. Please do so in the ‘Comments’ section. The more we discuss, the wiser we get. The wiser we get, the closer we may get to the pot of gold.
First, a look at the market for energy as it may evolve towards 2050. Note how heat below 400⁰C despite increased electrification, continues to show a steady annual demand of slightly more than 10,000 TWh.
Seasonal heat storage needs to be developed for solar thermal to fully replace fossil fuels. Until this potentially happens, solar thermal solutions need to be working in integration with fossil-based systems. A simple method for integration is to produce heat to existing storage tanks.
For day/night storage pressurized water tanks are available and able to do the job up +200⁰C. Some large industrials have such tanks installed already today to protect against risks of short-term interruption of their gas supply.
Day/night storage at this temperature level should allow industries to cover 30-40% of their demand. The coverage potential depends on how much the sun shines (expressed as DNI). For my estimates below, I assume DNI<1600 = 30%, DNI 1600-2000 = 35%, and DNI>2000 = 40%.
My analysis of the market opportunity goes as follows:
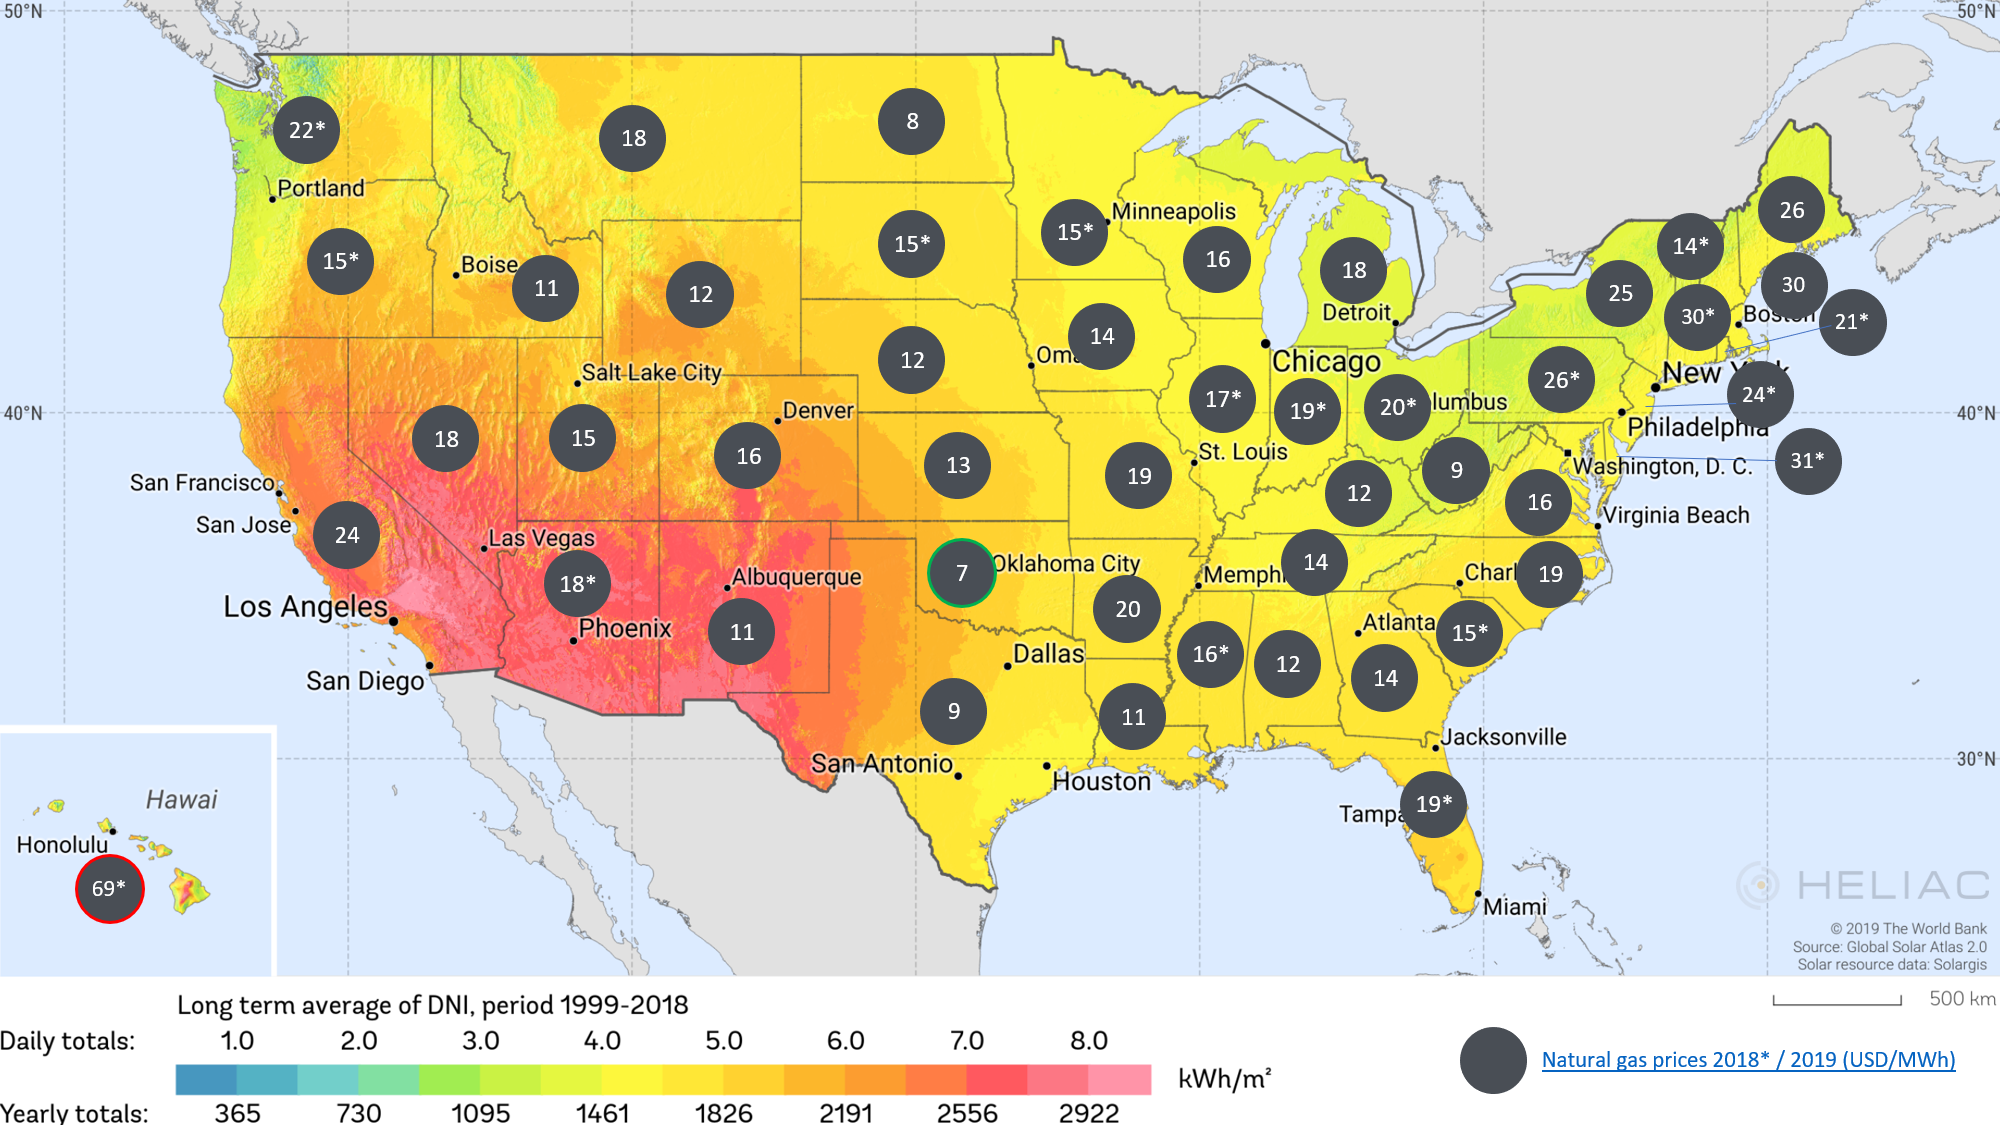
Figure 2: Industrial natural gas prices in the USA 2018*/2019 combined with a map of the average DNI (direct natural irradiation) in the period 1999-2018 [5+6].
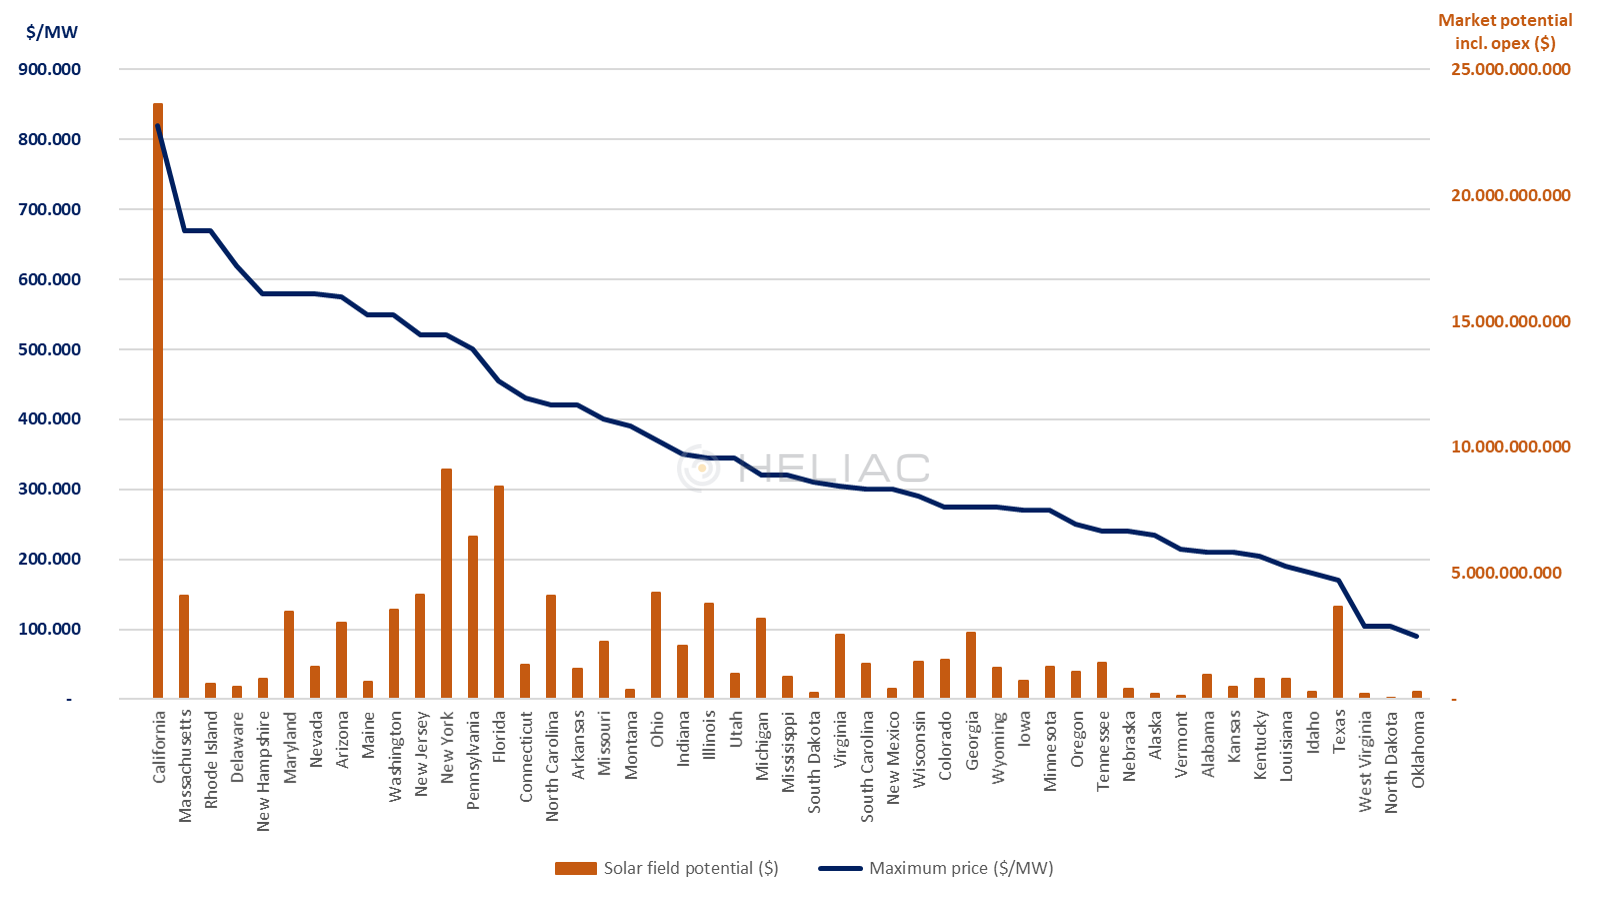
Figure 3: Solar field cost target ($/MW) to be met in each of the US states (ex Hawaii) in order to compete with local NG prices + revenue potential incl. operations & maintenance contracts. Assuming 25 years, 4% cost of capital, $5/MWh in operation & maintenance, 30-40% demand coverage with day/night storage.
The addressable market will increase with the introduction of cost-competitive heat storage technologies, and with the development of methods to use solar-generated heat to pre-heat higher temperature processes. E.g., pre-heating the feedwater in fossil-fired power plants in the US could increase the market opportunity with an additional 50,000 MW solar thermal capacity [8], thereby adding $25-30 billion to the US market potential.
If providers of solar thermal solutions turn to the world outside the US, e.g. Europe, then they are generally looking at markets with much higher industrial NG prices. The figure below shows minimum NG prices (in €) for large-scale end-users across Europe. Again, on the background of a map illustrating the local solar conditions.
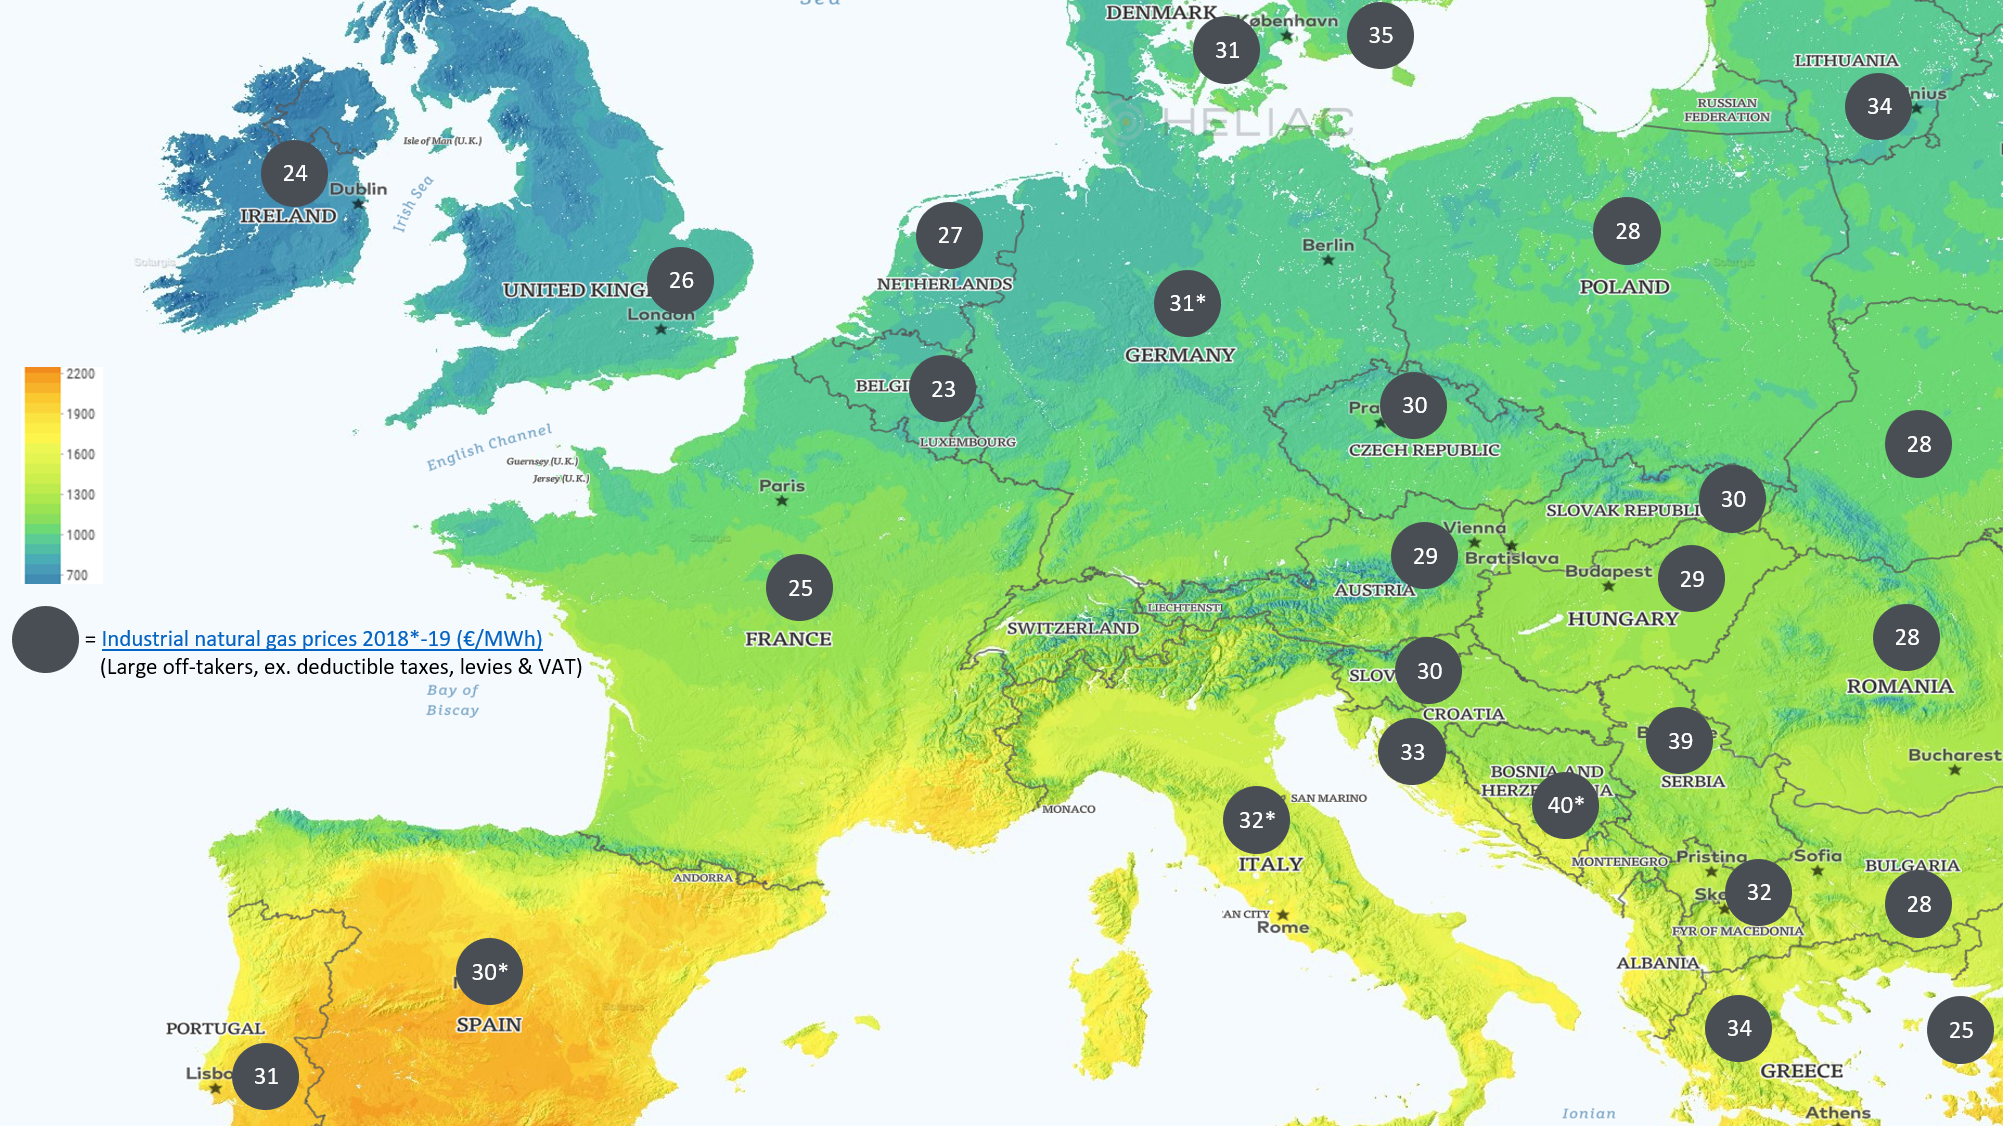
Figure 4: Net industrial natural gas prices for large off-takers in Europe 2018*/2019 [9] combined with a map of the average DNI [10].
I estimate the European consumption of industrial process heat in the 120⁰C-220⁰C range to be 1860 TWh [4+11+12]. Assuming DNI 1500 as an average, an average natural gas price of $35/MWh [9], and keeping other assumptions the same as for the US, this should allow for a price of $820,000/MW and a potential for installing 370 GW resulting in an opportunity worth $370 billion including service and maintenance.
For the rest of the world, I haven’t looked into the numbers in similar detail, but given the total size of the global energy consumption [2+3] and given most of the world outside the US has energy prices similar to Europe [e.g. 13], the total opportunity should be at least in the vicinity of $1 Trillion.
As the cost of solar field investment and maintenance is known, the price of the energy produced is also known. Facing the potential of increased costs from carbon emission taxes, increased pressure from climate concerned consumers, and other possible levies if governments start to factor the costs of particle emissions’ effect on their health systems and the general uncertainty from ever-fluctuating energy prices, many end-users are willing to pay a premium in exchange for the certainty of energy prices.
For example, in 2018 the average NG price across the US states was $21.2 per MWh but since 2015 the average monthly price has fluctuated in the range of $15-25 per MWh. To protect themselves against the risks of fluctuating energy prices, companies looking for stable prices can buy futures. The present average price for futures from 2020-2032 is $8.6 per MWh [14]. Likely, such a premium is only attractive to companies with very energy-intensive processes and investors betting on increasing prices. Still, the existence of the futures shows that fixed prices may justify a premium.
Based on this reasoning, I assume that end-users in the US on average are willing to pay a 15% premium on top of last year’s NG prices in exchange for securing a fixed energy price.
The cost of producing solar heat depends much on how much the sun shines. However, end-users can only be expected to care about how the cost of solar heat compares to heat produced by natural gas. As discussed above, for the US this means prices in the range of 8-34/MWh and around $35/MWh in Europe. Assuming an average NG price of $25 in the most relevant states, I have plotted the unsubsidized cost targets (in $/MW) as a function of the solar irradiation in the figure below.
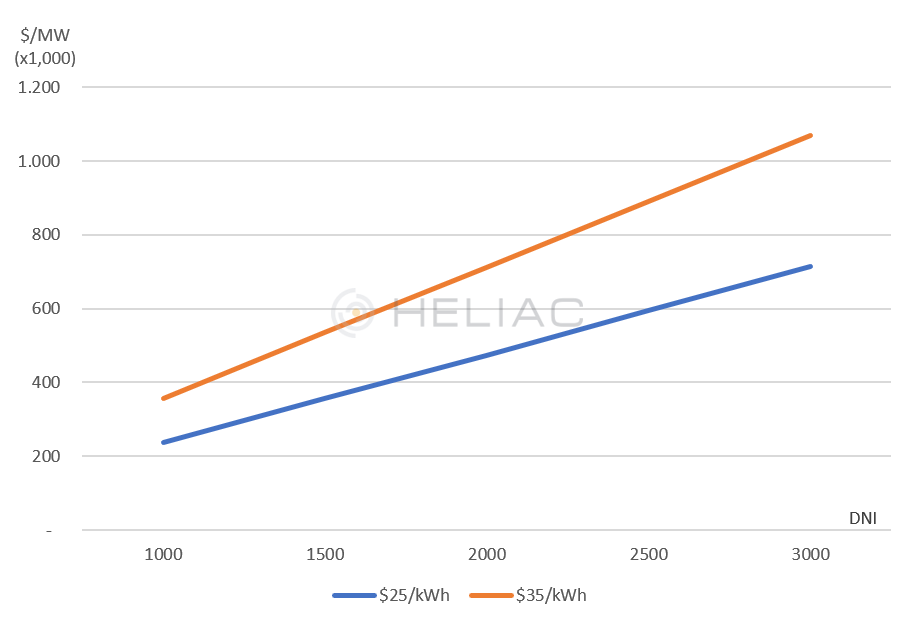
Figure 5: Possible unsubsidized market price ($/kW) for solar fields as a function of solar irradiation (DNI) when the market price is either $25/MWh or $35/MWh.
I believe the $25/MWh target is within reach. Getting there requires a look into the cost of land and heat transportation and an adjustment of the presently preferred business model in the solar thermal industry. This I discuss in the next article.
References:
[1] Solar for Industrial Process Heat: A Review of Technologies, Analysis Approaches, and Potential Applications in the United States, Schoeneberger C et al., Energy 206 (2020) 118083. https://www.sciencedirect.com/science/article/abs/pii/S0360544220311907
[2] Global Energy System Based On 100% Renewable Energy, LUT University & Energy Watch Group, 2019. http://energywatchgroup.org/wp-content/uploads/EWG_LUT_100RE_All_Sectors_Global_Report_2019.pdf
[3] Renewable Energy for Industry, Philibert C, International Energy Agency, 2017. http://www.solarpaces.org/wp-content/uploads/Renewable_Energy_for_Industry.pdf
[4] Initial Investigation into the Potential of CSP Industrial Process Heat for the Southwest United States, Turchi C, Kurup P, NREL, 2015. https://www.nrel.gov/docs/fy16osti/64709.pdf
[5] Natural Gas Prices, U.S. Energy Information Administration, 2020. https://www.eia.gov/dnav/ng/ng_pri_sum_a_EPG0_PIN_DMcf_a.htm
[6] Global Solar Atlas. https://globalsolaratlas.info/download/usa
[7] Annual Estimates of the Resident Population for the United States, Regions, States, and Puerto Rico: April 1, 2010 to July 1, 2019, United States Census Bureau, Population Division. https://www2.census.gov/programs-surveys/popest/tables/2010-2019/state/totals/nst-est2019-01.xlsx?#
[8] Solar-Augment Potential of U.S. Fossil-Fired Power Plants, Turchi C. et al, NREL, 2011. https://www.nrel.gov/docs/fy11osti/50597.pdf
[9] Prisdatabase, Energistyrelsen, 2020. https://www.ens.dk/sites/ens.dk/files/Statistik/prisdatabase.xlsx
[10] Global Solar Atlas. https://globalsolaratlas.info/map?c=47.517093,8.525391,6
[11] New IEA Report: Renewable Energy for Industry, SolarPaces, 2017. https://www.solarpaces.org/new-iea-report/
[12] Total Greenhouse Gas Emission Trends in Europe, European Environment Agency, 2019. https://www.eea.europa.eu/data-and-maps/indicators/greenhouse-gas-emission-trends-6/assessment-3
[13] Natural Gas Prices for Industry Worldwide as of 2018, By Select Country (in U.S. Dollars Per Megawatt Hour), Statista, 2020. https://www.statista.com/statistics/253047/natural-gas-prices-in-selected-countries/
[14] Dutch TTF Natural Gas USD/MMBtuICIS Heren Front Month Futures Apr, Barchart, 2020. https://www.barchart.com/futures/quotes/INKJ21/futures-prices
[All links retrieved 15 August 2020]
Jakob Steen Jensen