"Advancing Concentrating Solar Power Technology, Performance, and Dispatchability" research paper from the On the Path to SunShot series is now available on the DOE website.
The report shows, since the SunShot Vision Study (DOE 2012) was published, global deployment of concentrating solar power (CSP) has increased threefold to nearly 4,500 MW, with a similar threefold increase in operational capacity to 1,650 MW within the United States. Growth in U.S. CSP capacity has primarily been driven by policy support at the state and federal levels. State-driven renewable portfolio standards (RPSs), combined with a 30% federal investment tax credit (ITC) and federal loan guarantees, provided the opportunity for CSP developers to kick-start construction of CSP plants throughout the Southwest. Figure ES-1 demonstrates that deployment and private- and public-sector research and development have led to dramatic cost reductions that have placed CSP well on the path to reaching the U.S. Department of Energy’s SunShot Initiative goal of 6 cents/kWh by 2020. In comparing the estimated capital costs from the SunShot Vision Study and the current analysis, we find that the predicted 2015 decline in tower costs was in line with expectations, primarily driven by reduced heliostat costs. Figure ES-1 shows the reduction in levelized cost of electricity (LCOE) for both parabolic trough and tower systems, in addition to the projected 2020 SunShot target.
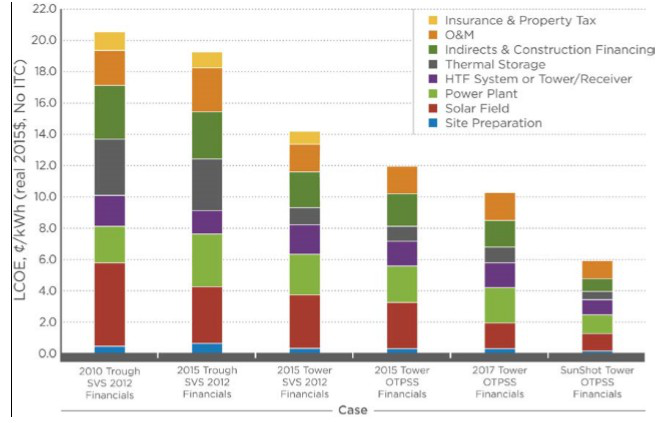
Figure ES-1. Cost reductions for parabolic trough and tower technologies since the SunShot Vision Study
SVS = SunShot Vision Study (DOE 2012)
OTPSS = On the Path to SunShot
Although the costs for troughs and towers have declined, CSP acceptance and deployment has been negatively impacted by the declining cost of photovoltaic (PV) technology. This situation can be mitigated when considering the flexibility offered by CSP with thermal energy storage (TES). A recent NREL study compared the combined operational and capacity benefits of CSP with TES relative to PV under varying levels of renewable penetration in California. The analysis found that the value of CSP, compared to variable-generation PV, demonstrated an increase in value of up to 6 cents/kWh under a 40% RPS, as shown in Figure ES-2.
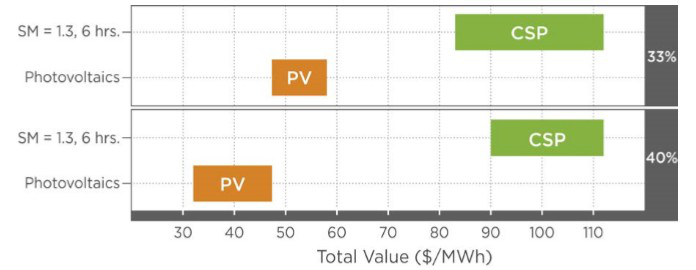
Figure ES-2. Total value, which includes operational and capacity value, of CSP with thermal energy storage and PV under 33% and 40% RPS scenarios
SM = solar multiple
This analysis and other similar analyses show that the high grid value of CSP-TES, not just the LCOE, must be considered when evaluating the portfolio of renewable energy technology options. A more comprehensive methodology—an assessment of the net system cost—includes comparisons of both costs and grid-wide system benefits of different technologies. The net system cost of a resource represents the difference between the annualized costs of adding a new conventional or renewable generating technology (e.g., CSP-TES, PV, combustion turbines, combined-cycle plant) and the avoided cost realized by displacing other resources providing similar levels of energy and reliability to the system. Net system costs are shown in Figure ES-3 for three CSP systems representing peaking, intermediate load, and baseload configurations relative to conventional natural-gas-fired combustion-turbine (CT) and combined-cycle (CC) plants offering 1,500 MW of reliable capacity. Figure ES-3 shows that, assuming today’s low natural gas prices and carbon emission costs, there is a preference toward choosing a peaking configuration for CSP. However, this decision becomes less clear under a scenario of high natural gas prices and emission costs. In that case, each of the CSP configurations compares very favorably against the conventional alternatives, with systems having intermediate to high capacity factor becoming the preferred alternatives. (Capacity factor is defined as the ratio of actual annual generation to the amount of generation had the plant operated at its nameplate capacity for the entire year.)
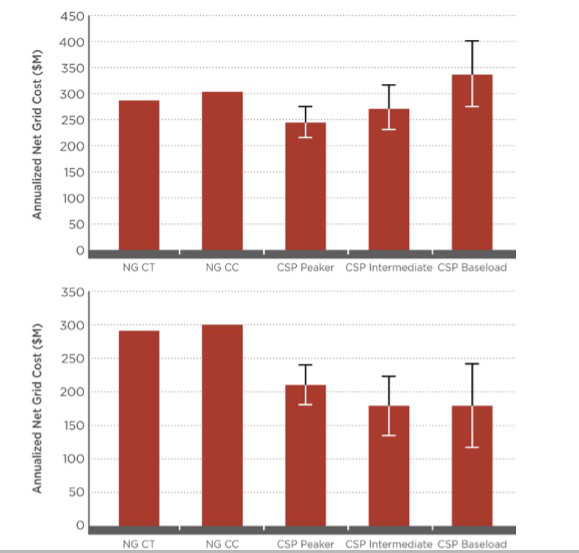
Figures ES-3. Low natural gas and emission cost scenario (top) and high natural gas and emissions cost scenario (bottom)
Comparison of net cost for SunShot CSP configurations;
Uncertainty bars represent ±10% variation in SunShot parameters.
Net system costs are similarly shown in Figure ES-4 for three configurations of CSP compared to PV with batteries (where a range of battery costs and lifetime are assumed) and PV with CTs. Each of these technology options provides the same reliable capacity. Figure ES-4 indicates that under current technology costs, the least-expensive option considered is a combination of solar PV and gas CTs, which is not surprising because CSP-TES and grid-scale batteries are relatively immature technologies. These results change when considering future costs. The most optimal configuration of CSP is lower cost than the range of PV-plus-battery costs considered.
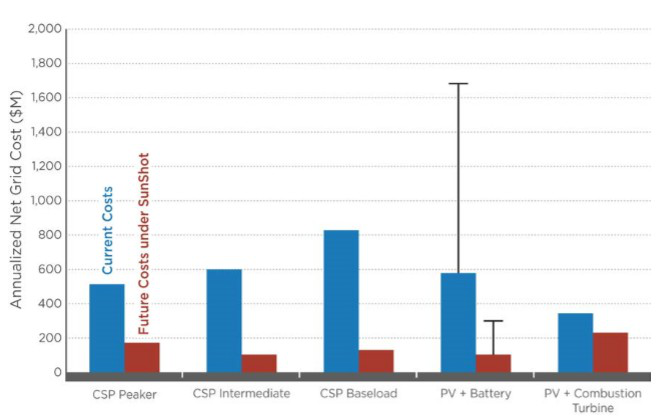
Figure ES-4. Annualized net cost results for analysis of current and future cost scenarios for CSP, PV with batteries, and PV with combustion turbines
CSP peaker, intermediate load, and baseload configurations are identical to those shown in Figure ES-3.
This report is available at no cost from the National Renewable Energy Laboratory (NREL) at www.nrel.gov/publications.
Advancing Concentrating Solar Power Technology, Performance, and Dispatchability